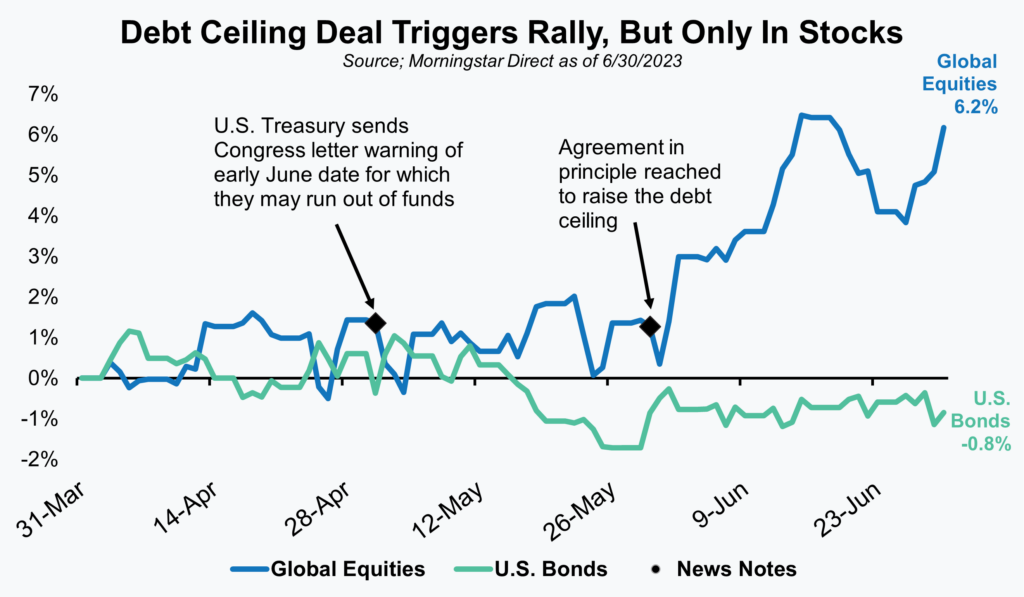
The most noteworthy event for the quarter was undoubtedly the debt ceiling negotiations and eventual deal to raise the ceiling that unfolded through May and early June in the nation’s capital. It wasn’t necessarily much of a surprise to see stocks rally upon news of a deal, but results leading up to that, for both stocks and bonds, were curious. Given the potentially disastrous financial consequences that a U.S. government debt default could have triggered, it was rather remarkable that neither market ever really panicked. Through April and May, even after the U.S. Treasury outlined to Congress that a default could occur as early as June 1st, stocks and bonds basically traded in a very narrow range. Investors may not have been rushing to put new capital to work, but they also clearly believed that a default would not happen. Thankfully they were right on the latter!
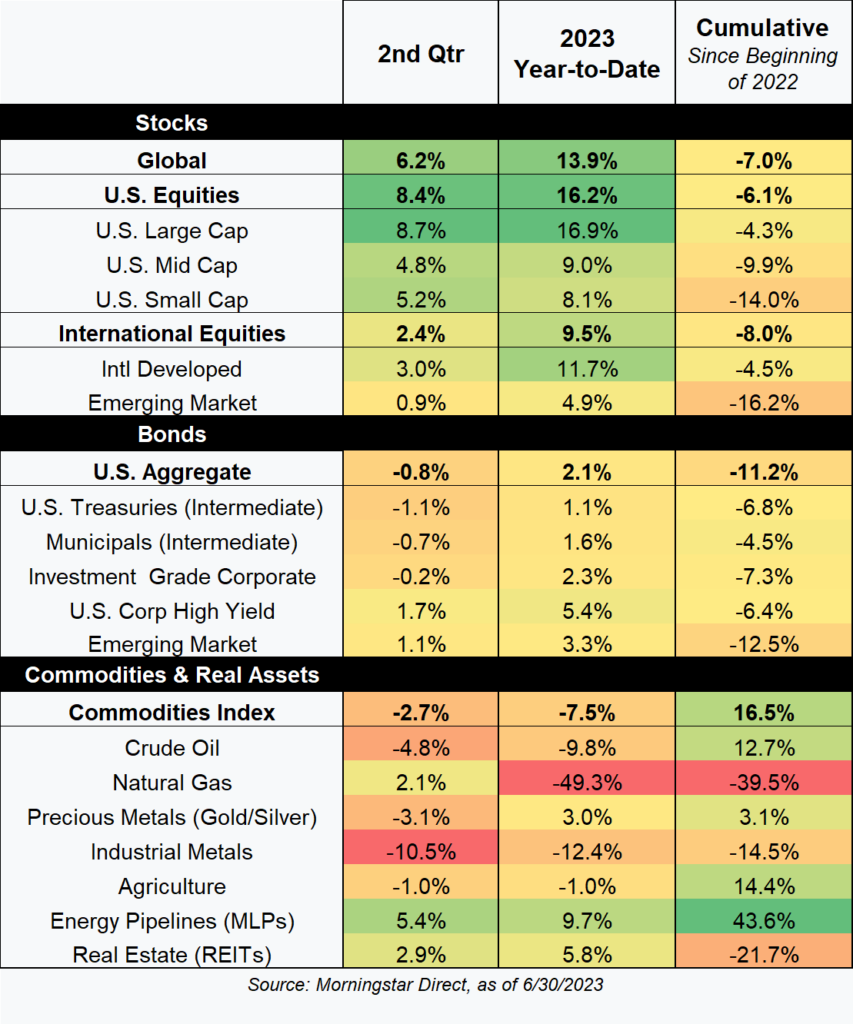
Last quarter we started off your CFO Report with a graph titled “All’s Well That Ends Well”. We could easily have stayed with that same theme again this quarter. During the first quarter, markets weathered concerns in the banking sector but finished higher. This past quarter it was the debt ceiling that caused investor angst, but again markets fared relatively well in the face of that uncertainty. Bonds did fall slightly, but equities were positive by a meaningful percentage. As shown in the far-right hand column of our Market Heat Map, both still have ground to make up from the start of the selloff in 2022, but progress is being made in the right direction for most diversified investors.
Equities
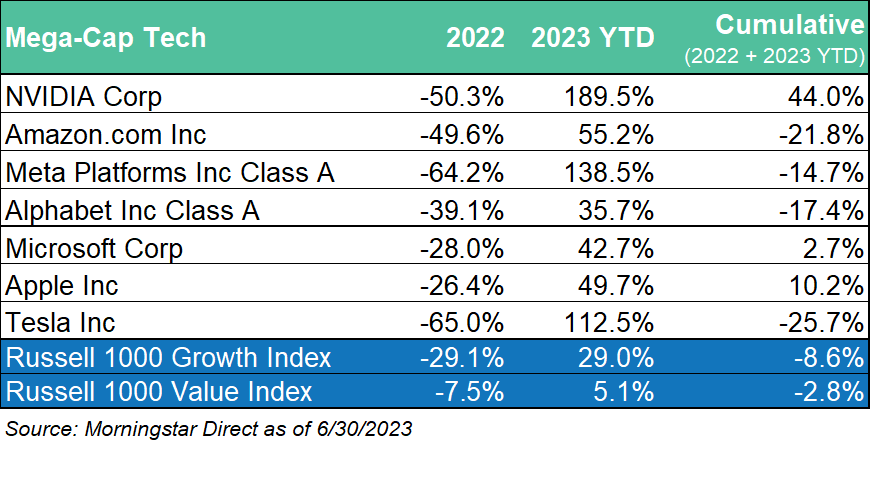
If the debt ceiling deal was the dominant headline for stocks generally, then within equities the big story has been with mega-cap tech stocks. The broad equity market rally that began last October has narrowed quite a bit during the first half of 2023. In fact, for much of the past few months nearly all the gains in U.S. markets could be attributed to just a handful of mega-cap tech stocks with outsized gains. Those gains helped mask more lackluster returns experienced by the majority of stocks.
As the table of returns shows, some of the year-to-date (YTD) gains in names like NVIDIA, Meta Platforms (formerly Facebook), and Tesla have been truly impressive. All three are up over more than 100%! Unfortunately for many investors in those names, the strength this year has yet to quite make up for the disproportionately large losses those names suffered last year. NVIDIA is the clear exception, and Microsoft and Apple are also up slightly, but the other four names remain down more than 15%. In fact, large cap growth stocks, as represented by the Russell 1000 Growth Index, remain down close to 9% for the last 18 months. They also remain almost 6% behind large cap value stocks for that same timeframe.
We know investors are often tempted to simply add or average returns together when looking at performance over multiple time periods. That would be dangerously misleading in the case of large cap growth stocks over the last 18 months. For example, simply adding the +29.0% return for large cap growth this year to last year’s -29.1% would lead to an expectation that those stocks had recovered all their losses from 2022. Unfortunately, that would be incorrect (since as noted that market remains down nearly 9%). Compounding returns means that the more something falls in one year, the greater the percentage gain is required to get back to even. For example, an investment that falls from $100 to $75 has fallen 25% ($25/$100). For that investment to get back to $100 it may need the same dollar increase of $25, but because the starting point is now $75 that translates to a required percentage return of +33.3% ($25/$75). Coming back to our growth versus value comparison, that means growth has more ground to make up and because value didn’t fall nearly as much in 2022 it is closer to breakeven despite a much smaller positive return year-to-date.
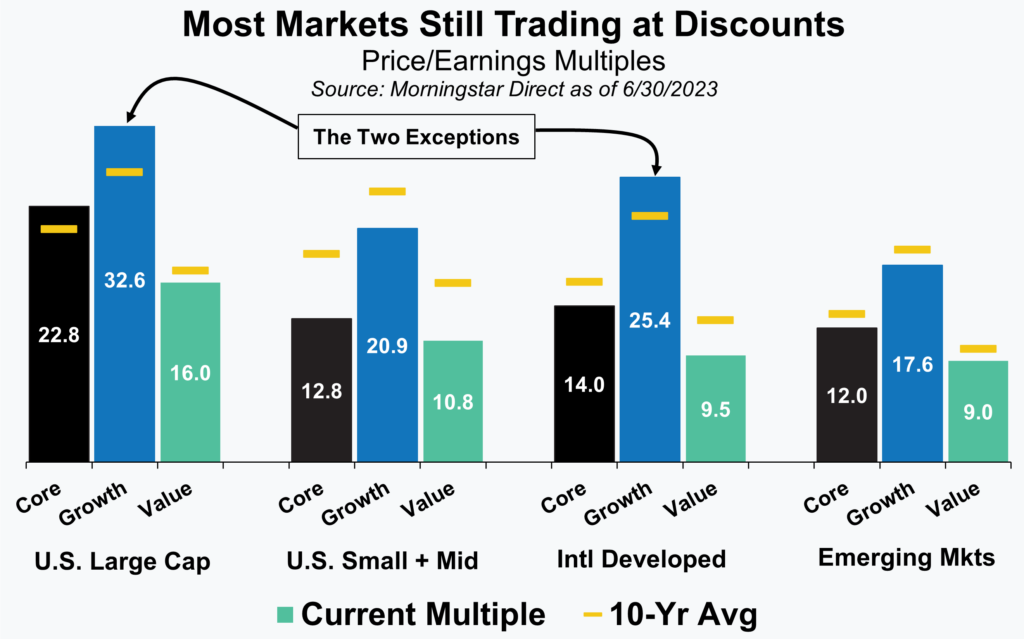
While we understand the excitement the past few months about growth stocks and are happy to see them bounce back, we’d also caution investors about what the path forward might look like. After correcting back to more reasonable levels last year, growth stock valuations in U.S. large cap and international developed markets are again back to elevated levels when compared to history. Not all markets are as “stretched” from a valuation standpoint. In fact, as this graphic shows there are still plenty of areas of the equity market that are trading at earnings multiple discounts to where they’ve traded over the last 10 years (yellow line). Naturally, as value focused investors that has influenced where we’ve tilted the equity portion of our portfolios.
Fixed Income
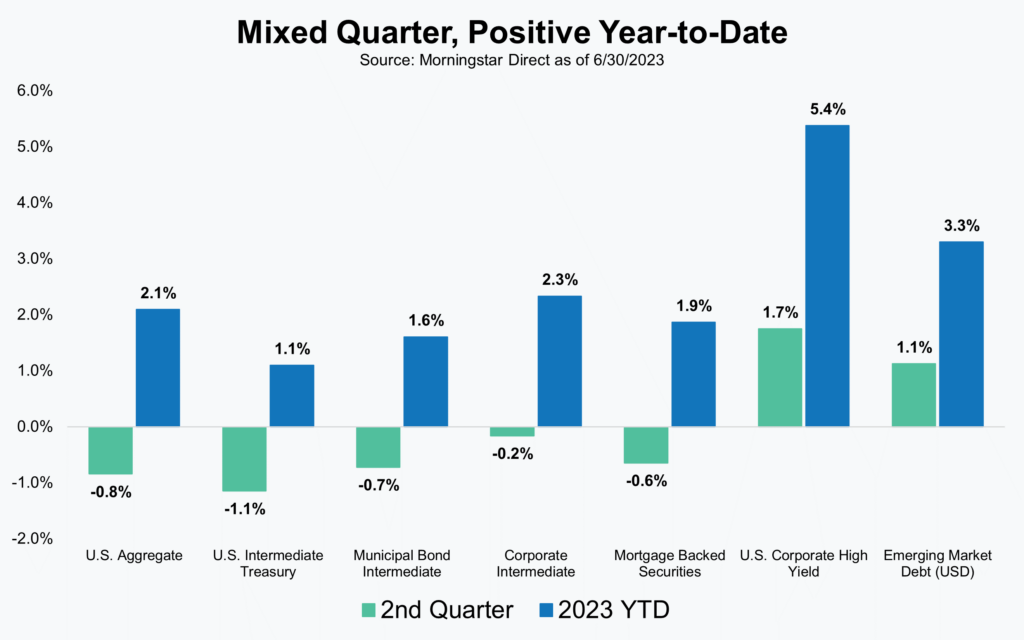
After a historically volatile and negative period for bonds during 2022, it may surprise investors to know that the slightly negative returns (-0.8%) for the core U.S. bond benchmark this past quarter broke a string of two consecutive quarters of positive returns. Bonds still have considerable ground to make up (even more than equities), but with the Fed getting closer to being done with their rate hikes, markets do appear to have stabilized and returned to some sense of normalcy. Even the threat of a U.S. debt default in June did little to change bond yields for maturities beyond a few months.
Bond yields did increase slightly during the quarter with the 10-Year U.S. Treasury yield, increasing from 3.48% to 3.81% at quarter end. Since bond prices and bond yields move in opposite directions that meant that bond prices, and as a result bond returns, were lower at quarter end.
Fortunately for fixed income investors the news wasn’t all negative. Returns were only marginally negative and not all areas of fixed income fell for the quarter. Year-to-date results are also still solidly positive. Despite the increase in yields for U.S. Treasuries, some areas of fixed income were able to eke out positive returns due to a higher starting point yield and tighter credit spreads.
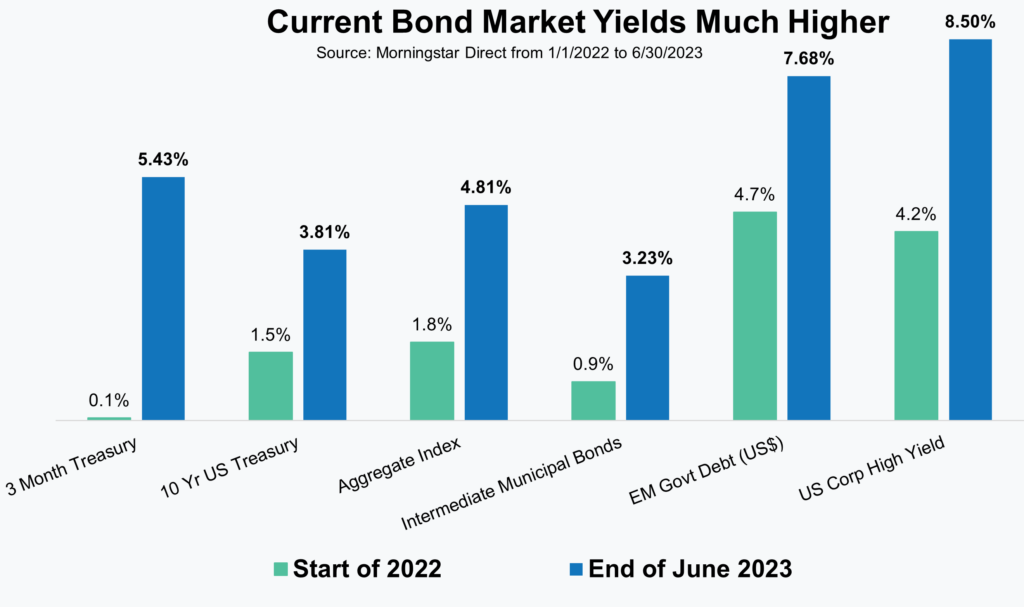
After more than a decade of low yields and mostly tight credit spreads, we believe fixed income markets today represent a relatively attractive opportunity. The path of returns that led to this point was painful, but with the Fed nearly finished hiking rates and inflation receding we think investors should feel encouraged about return prospects moving forward. The change in yields over the last 18 months has been significant and can be seen in the comparison of yields at the start of 2022 with where they are now. Those higher starting point yields should lead to returns that follow suit.
Commodities + Real Assets (+ Alternatives)
In keeping with the last few quarters, we thought we’d again focus this section less on recent returns (which can be found in our Markets Overview section) and more on helping investors understand asset classes and strategies that fall outside of the more traditional stocks and bonds. Investments in commodities, real assets, trading strategies, or what we’ll broadly refer to as alternatives can play an important role in a diversified portfolio, but they are also more difficult to understand and gain comfort with.
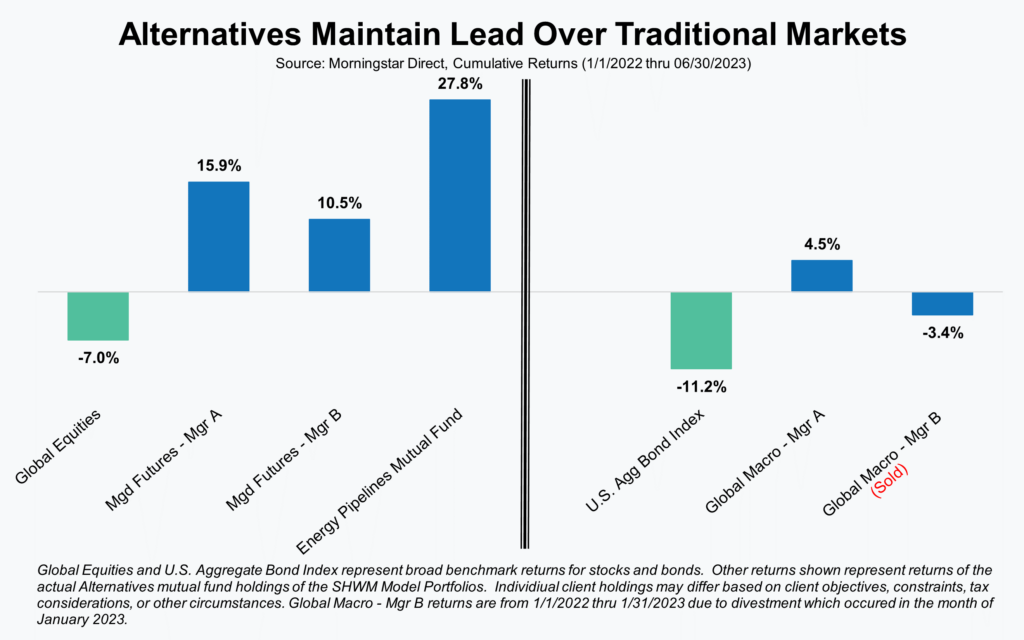
Perhaps once traditional markets for stocks and bonds get back to flat or even from the start of 2022 we’ll retire this graph, but with both markets still down over that period and slowly climbing their way back we still see value in it and the discussion it results in.
Despite the modest recovery in traditional markets, both stocks and bonds have additional ground still to make up. The gap has narrowed, but we’re still happy to say that the alternatives we’ve used have helped our investors avoid some of the negative returns in those traditional markets. In the case of our two trend-following managed futures strategies and our energy pipelines holding, alternatives we allocate funds to in place of more equities, those returns have been meaningfully positive. In the case of our two global macro strategies, alternatives we allocate capital to in place of more fixed income, those returns were roughly flat on a combined basis and better than the benchmark index.
As our investors have hopefully come to understand though, we do not believe in a static allocation to alternatives. We make allocation decisions and adjustments based on the relative attractiveness of traditional markets. In simple terms, we allocate more capital to alternatives when we believe traditional markets are expensive and less when those markets become cheaper or more attractive. Because of that, we thought it would make sense to provide an update on where we are in our thinking and expectations.
With regard to global equities, managed futures, and the energy pipeline strategies we’ve continued to make adjustments. Last year our changes were to take advantage of the weakness in equities and the positive performance in several of our equity alternatives. At different points we’d sold managed futures and some of the energy pipelines to add to global equities. With equities having now rallied considerably since last September we recently reversed course, at the margin, by trimming equities and adding back to our managed futures. While we still believe equities represent fair to attractive values they are no longer as broadly cheap as they were a few months ago and we wanted our position to reflect that. On the fixed income side, our last change was back in January, and we do not anticipate any further changes at this time. While one of the global macro strategies did better than the other last year, both did their job in protecting capital during the bond market selloff. With bond yields materially higher after the selloff, we wanted to take advantage of those higher yields and expected returns which resulted in our sale of one of the global macro strategies. At current yields, which we find attractive, we are happy with our current positioning that favors more traditional fixed income.
As always, our team of advisors is available and ready to answer your questions on these or other topics related to investments and financial planning. Please call us at 404-874-6244 or email us here.
Unless stated otherwise, any estimates or projections (including performance and risk) given in this presentation are intended to be forward-looking statements. Such estimates are subject to actual known and unknown risks, uncertainties, and other factors that could cause actual results to differ materially from those projected. The securities described within this presentation do not represent all of the securities purchased, sold or recommended for client accounts. The reader should not assume that an investment in such securities was or will be profitable. Past performance does not indicate future results.
Want to get insights right to your inbox?
Subscribe to our newsletter to get inside access to timely news, trends and insights from Smith and Howard Wealth Management.
 July 10, 2023
 Back to Insights