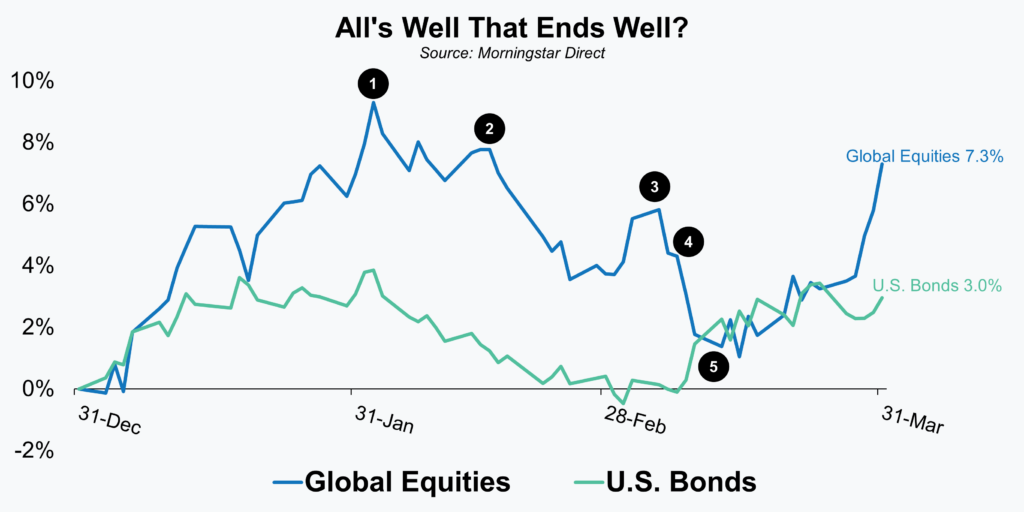
Investors enjoyed a solid start to the new year as the positive momentum that began last October for stocks and bonds carried into January. However, it wasn’t all smooth sailing during the first quarter as investors continued to fret over the direction of inflation, interest rates, and the global economy. In fact, as we’ve detailed in the following graph and accompanying table, essentially all of the key turning points for the quarter were directly or indirectly tied to those issues or concerns.
All’s Well That Ends Well? Turning Point Details
1. A strong employment report caused investors to revisit expectations that the Fed is close to completing their cycle of rate hikes.
2. Inflation data for January came in higher than anticipated and led to more speculation that the Fed will not only have to raise rates more than previously anticipated, but also keep them there for longer.
3. Federal Reserve Chairman, Jerome Powell, more or less confirmed what the market had begun to suspect – that recent employment and inflation data may mean that the next rate hike could revert back to increments of 0.5% (prior rate hike had been just 0.25%).
4. Issues in the banking sector came to the forefront after the failure of three small to mid-sized banks. While all three had unique characteristics that made them inherently riskier institutions, at the heart of their issues were losses on U.S. Treasury bonds caused by the Fed’s rate hiking campaign.
5. Driven by the aforementioned banking sector concerns the Fed, the Treasury, and the FDIC issued a joint statement announcing several items, most importantly the creation of a new lending facility aimed at easing bank funding concerns.
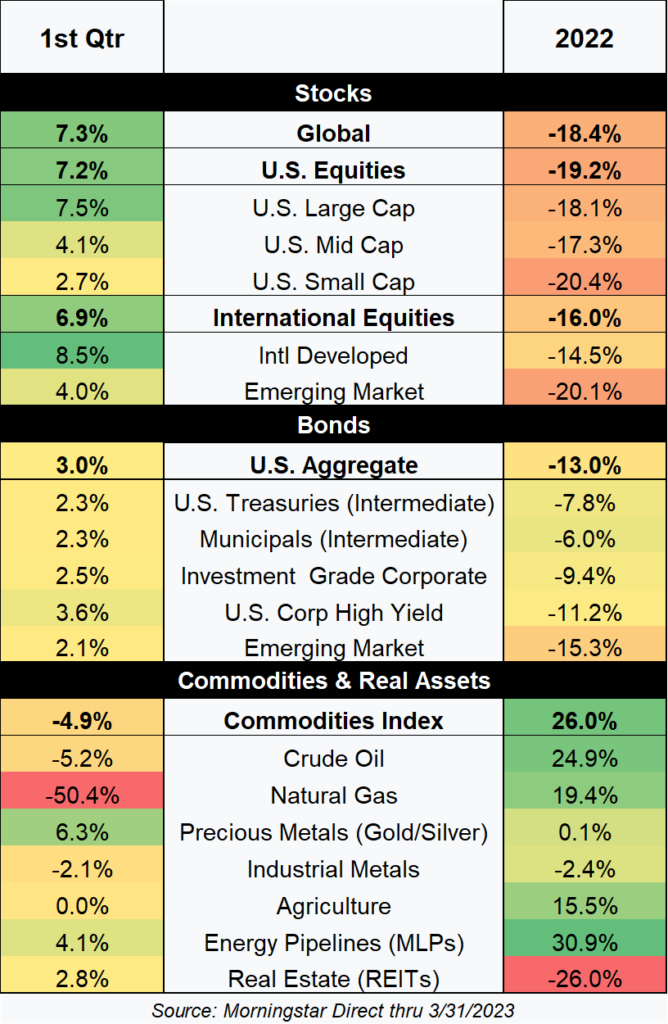
Every quarter is full of twists and turns, this past quarter was certainly no exception. Despite a myriad of issues and concerns, stocks and bonds broadly managed to emerge from the period in positive territory. Commodities, hard assets, and various “alternatives” were more of a mixed bag as detailed in the accompanying “Heat Map”. For reference and comparison, we’ve elected this quarter to include not just the returns of the recent three months, but also for the full year of 2022. As welcome as recent positive returns have been, clearly most markets still have a long way to go to recover from the prior year losses.
Equities
Equities may have finished off their highs for the quarter, but investors still enjoyed meaningfully positive returns highlighted by results in international developed markets and global growth stocks.
To the surprise of many U.S. investors, the outperformance of international developed markets continued despite ongoing concerns about the war in Ukraine and its expected broader consequences. Dating back to the start of this past November, international developed markets have now outperformed U.S. markets by an impressive 12.4%. Geopolitical concerns may have driven many U.S. investors out of international stocks last year, but a falling U.S. dollar, a warm winter that kept energy supply concerns in check, and better than feared economic results drove upside which rewarded those that stayed.
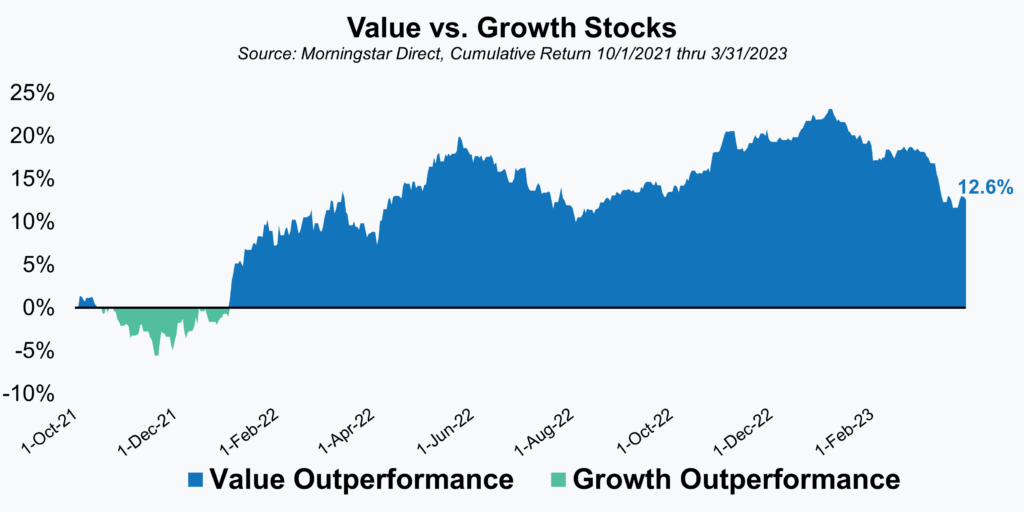
The resurgence and outperformance in growth stocks during the quarter is harder to explain as there didn’t appear to be any obvious or specific catalysts. Nevertheless, global growth stocks enjoyed a return of 13.8% while global value stocks returned just 1.2%. As the saying goes, sometimes the best explanation is the simplest one. As the below chart illustrates, value stocks had enjoyed a strong period of outperformance relative to growth stocks dating back to late 2021. Trends rarely occur in a straight line, so some rotation back towards growth was bound to happen at some point. Value stocks have still outperformed growth over the last year and a half by 12.6%, but the level of outperformance has been cut nearly in half over the last few months.
Most importantly, we still favor value stocks over growth stocks moving forward. The last 18 months have reduced the valuation differential between growth and value stocks, but our preferred valuation metrics still favor value stocks. For example, global growth stocks currently trade at a price to earnings multiple that is nearly two times that of global value stocks. Due to their higher growth rates it is perfectly normal for growth stocks to trade at a higher multiple or premium to value stocks, but over the past 20 years that ratio has been closer to 1.5 times.
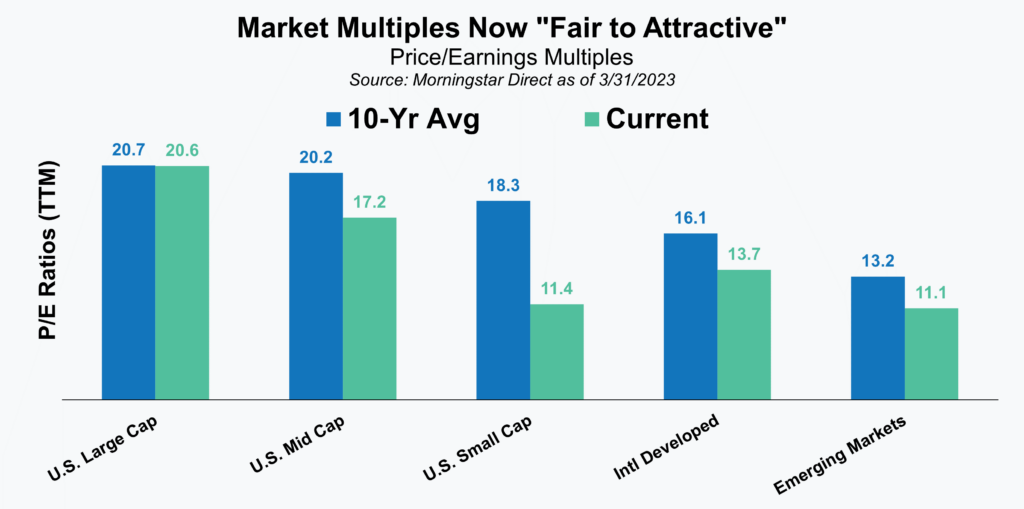
As we’ve written before, as painful as 2022 was for investors, it did return some normalcy to market valuations and our return outlook. The past two quarters of positive equity market returns have thankfully done little to change that overall picture. The price to earnings multiple for various major market segments shows that most markets presently trade well below their 10-year average multiple. The lone exception to that being U.S. large cap which sits very close to its average. While we recognize that valuations are a poor predictor of short-term returns, they are a very good predictor over the long-term and current valuations give us reason to be optimistic moving forward.
Fixed Income
Fixed income investors continued to experience unusual levels of volatility in early 2023. Fortunately (and unlike last year), that volatility led to positive returns. As we detailed in our market overview, the path for the quarter was anything but a straight line. In fact, after being up as much as 3.9% early in the quarter, the broad fixed income benchmark for a U.S. investor briefly turned negative for the year in early March before rallying into quarter end.
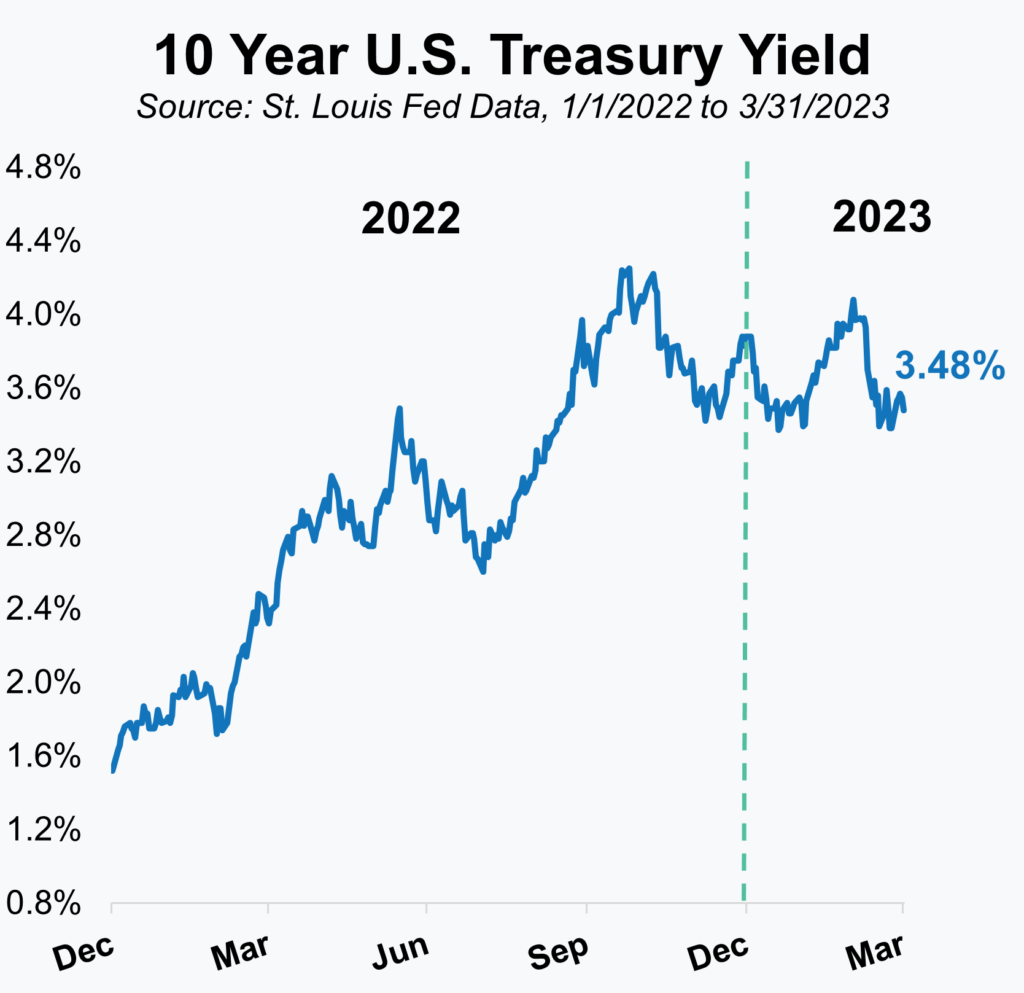
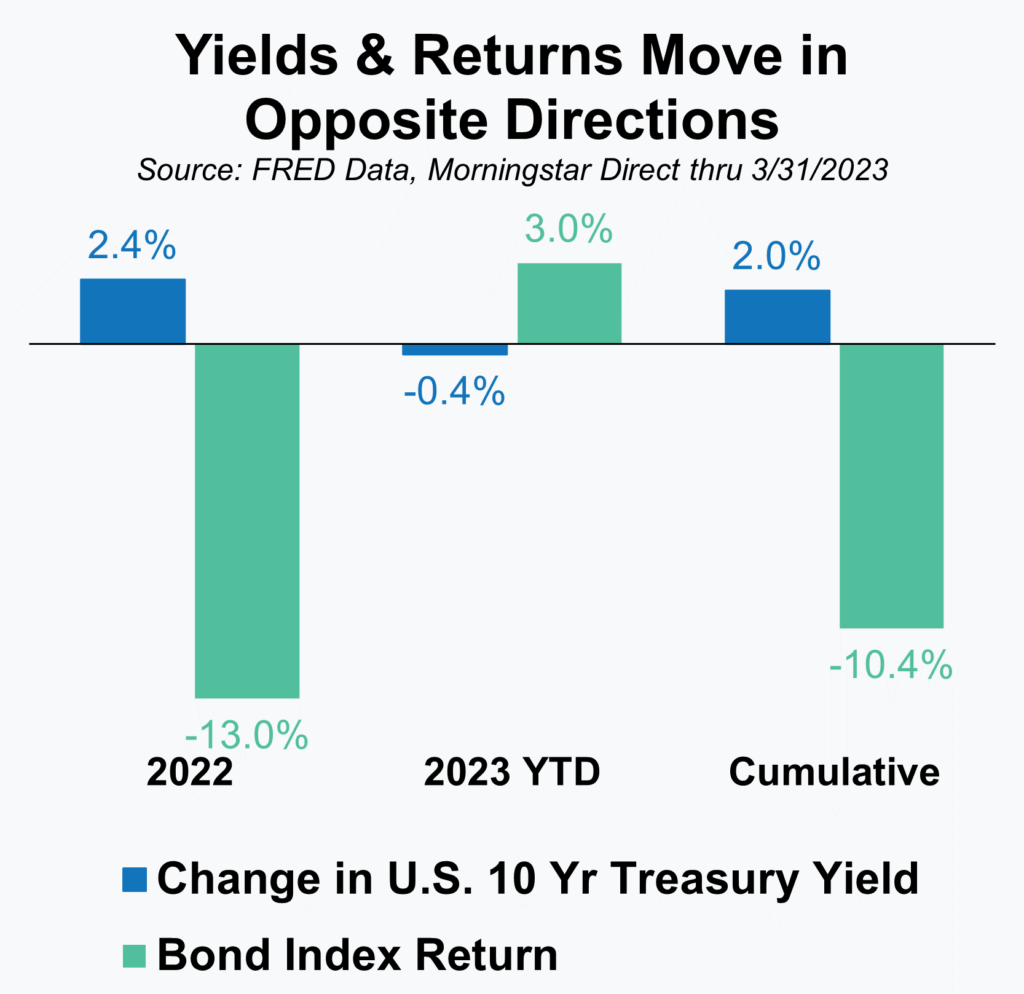
As our two charts here show, after enduring a historic and steep rise in yield over the prior 12 months, the yield for the U.S. 10-Year Treasury bond and most intermediate duration bonds fell modestly during the first quarter. Since yields and prices for bonds move in opposite directions, that meant prices and returns were higher. Bonds still have a lot of ground to make-up after a dismal 2022, but the past three months were a step in the right direction.
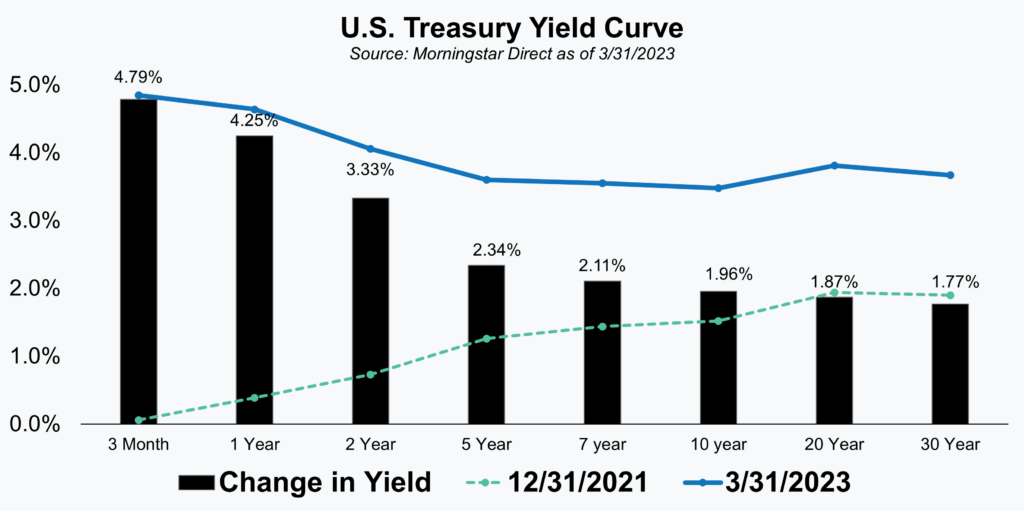
Looking forward, the three big storylines within the world of fixed income will likely be 1) the inversion of the yield curve 2) the higher current yields when compared to anytime over the past decade or more and 3) issues related to the U.S. debt ceiling. We’ll cover the first two storylines in this writing, but leave the debt ceiling debate for a separate communication that my colleague, Valerie Nichols, is already working on.
As the graph shows, the current yields (the blue line) on shorter maturity bonds exceeds that of bonds further out the yield curve. For example, the 2-Year U.S. Treasury yield of 4.06% is higher than the 10-Year U.S. Treasury yield of 3.48%. That is not the normal relationship between the two and hence why it is considered “inverted”. The importance of this inversion lies in its significance as an indicator of future economic growth – or lack thereof. Historically, an inverted yield curve has been one of the best, if not the best, signals that the economy is headed for a recession.
We’d urge investors not to overreact to the inversion discussion or conjecture at this point. While the U.S. could very well be headed for an economic slowdown, this isn’t necessarily new or unanticipated information. The treasury yield curve has been inverted since July of last year and entering the year, roughly two-thirds of economists were predicting a recession during 2023. If a recession does occur it’ll be perhaps the most anticipated or expected recession in history. Since markets anticipate or “place their bets” on what they think may happen in the future and a recession is already expected that outcome is likely reflected in current market prices.
Longer term we continue to be more positive on future bond returns than we have been since the 2007-08 financial crisis and the era of historically low interest rates that followed it. The path to higher rates and bond yields experienced during the prior year was admittedly painful, but the positive is that rather than a long, drawn out process the adjustment was rather quick. Investors are suddenly, and finally, more adequately rewarded for owning bonds. The increase in yields over just the past 15 months, as shown in our graph (black bars and numbers) is rather remarkable.
Commodities + Real Assets (+ Alternatives)
In keeping with the last few quarters, we thought we’d again focus this section less on recent returns (which can be found in our Markets Overview section) and more on helping investors understand asset classes and strategies that fall outside of the more traditional stocks and bonds. Investments in commodities, real assets, or what we’ll broadly refer to as alternatives can play an important role in a diversified portfolio, but they are also more difficult to understand and gain comfort with.
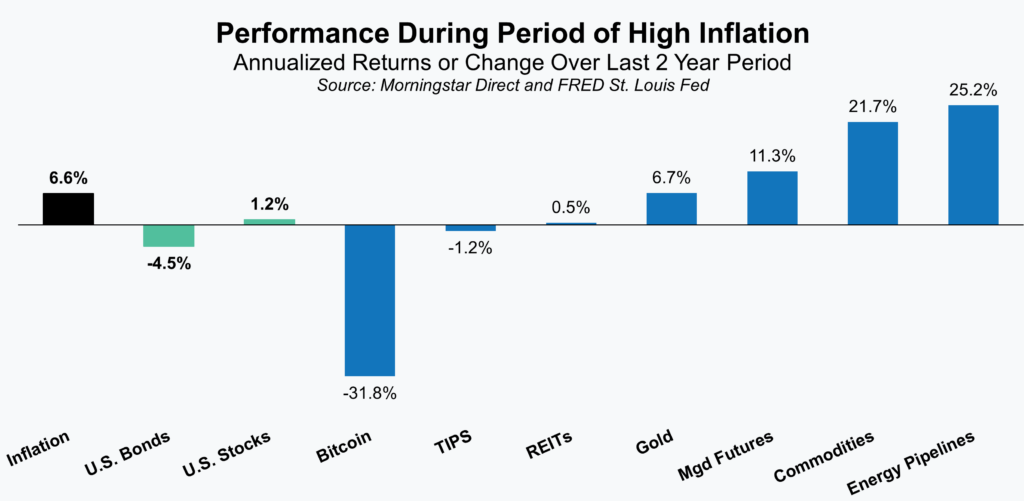
After more than a decade of fading appeal, alternatives have seen a recent surge in interest. While some of that increase can be attributed to the poor performance last year of traditional stocks and bonds, the purported inflation benefits associated with various alternative assets and strategies were also a driver. Given the questions we’ve received from investors over the past two years about inflation and some of the ways to hedge or profit from it, we thought it would be interesting to review the performance of some of the more popular inflation hedges and strategies. In our review of performance figures, shown in the accompanying graph, we looked at annualized figures over a two-year period for inflation (black bar), traditional stocks and bonds (green), as well as some of the more popular inflation hedges (blue). We chose the two-year period due to it being two years ago (April of 2021) that the U.S. Consumer Price Index (CPI) first rose above 3% on a year-over-year basis. As we all know, inflation moved considerably higher, but that month marked a clear turning point when it came to inflation and its impact on consumers and investors.
Results vary greatly, both from an absolute return perspective and in relation to inflation. Given that inflation pressures played a significant role in stock and bond market weakness last year, it’s not surprising to see that neither kept up with inflation over the full period. Bitcoin was the opposite of any sort of inflation hedge losing roughly a third of its value each year (a total cumulative loss of -53.5%). While we don’t consider bitcoin an investable asset or something we’d allocate capital to, we included it here due to the widely held belief by crypto supporters that it would be a good inflation hedge. Treasury Inflation Protected Securities (TIPS) and Real Estate Investment Trusts (REITS) were poor hedges, while gold did essentially match inflation.
A few of the more effective “hedges” against inflation ended up being one of our preferred alternatives strategies, Managed Futures, a broad commodity index, and a commodity related area focused on energy infrastructure. With respect to the two latter areas, we don’t typically invest directly in commodities, but our portfolios did benefit from an allocation to an energy infrastructure strategy.
As mentioned, results varied greatly and that should not come as a surprise. Every inflationary period is different, but more importantly inflation isn’t the only driver of performance for each of the investment types we included. That last note is one reason we think investors need to be careful about reverting to an inflation “playbook”. What worked in the past or on average has worked during a particular type of market environment quite often fails to live up to expectations the next time around. That’s why when we look to allocate capital our focus is on valuations or an interest in owning it in any environment. If it happens to have characteristics that help during inflationary periods all the better, but we wouldn’t let that one factor override the others.
One Final Note
Be on the lookout for a future communication from my colleague Valerie Nichols, that will focus on the U.S. debt ceiling issue. We remain hopeful that an agreement can be reached and the issue will become a moot point – as it has many times in the past. We recognize the risks though and believe the topic is worthy of its own discussion separate from our general market overview and outlook.
As always, our team of advisors is available and ready to answer your questions on these or other topics related to investments and financial planning. Please call us at 404-874-6244 or email us here.
Unless stated otherwise, any estimates or projections (including performance and risk) given in this presentation are intended to be forward-looking statements. Such estimates are subject to actual known and unknown risks, uncertainties, and other factors that could cause actual results to differ materially from those projected. The securities described within this presentation do not represent all of the securities purchased, sold or recommended for client accounts. The reader should not assume that an investment in such securities was or will be profitable. Past performance does not indicate future results.
Want to get insights right to your inbox?
Subscribe to our newsletter to get inside access to timely news, trends and insights from Smith and Howard Wealth Management.
 April 11, 2023
 Back to Insights