“Only when the tide goes out do you discover who’s been swimming naked”
– Warren Buffett
One of the things that has made the first half of this year so difficult for investors has been the simultaneous selloff in both stocks and bonds. Making matters worse, unfortunately, is the fact that the drawdown in each ranks among some of their worst over a six-month timeframe(1) dating back more than 45 years. As a result it’s understandable that most investors may feel like they were “swimming naked” the past few months.
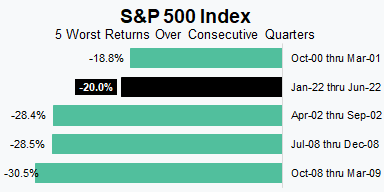
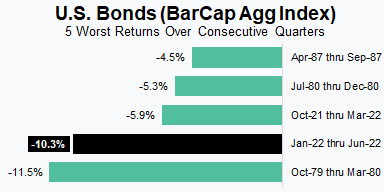
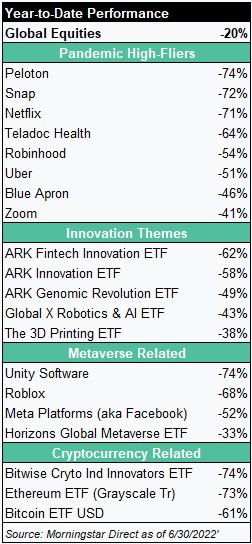
The unfortunate reality is that since most investment portfolios are comprised largely of stocks and bonds there have been very few places for investors to “hide”. There have been plenty of places, however, for investors to get more than a little tripped up. As bad as things appear when looking at broad market indexes, pockets of the market have fared far worse. Many of those pockets have been some of what we’ve considered the more speculative areas of the market.
Our portfolios and investors have certainly not been immune to the selloff, but given the circumstances we’ve been pleased with how well they’ve held up. Driven by our valuation work and process we entered 2022 defensively positioned and that has been to our advantage over the last few months. To reference back to the Buffett quote, we’d argue that we entered the year swimming close to shore decked out in a full body wetsuit. Again, our positioning didn’t avoid losses altogether, but it did result in noticeable outperformance (relative to benchmarks and summarized below) in each of our three main portfolio components.
- Bonds: our focus on shorter duration bonds helped reduce some of the losses driven by rising interest rates.
- Stocks: our overweight to value stocks and their continued outperformance relative to growth stocks (like those in the table of returns above) helped reduce the downside experienced within equities.
- Alternatives: our mix of alternatives strategies generated a positive return for the first six months of the year which obviously helped offset losses in other parts of the portfolio.
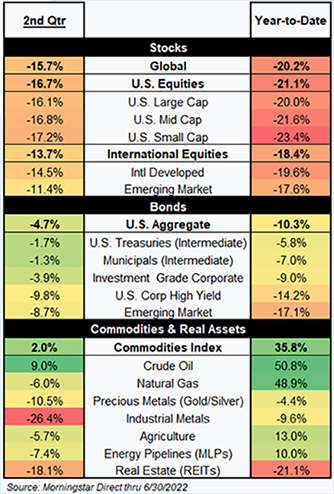
We never expect an investor to be happy or satisfied with negative returns, but we also know periods like the past six months are part of investing. Realistically, our goal during such periods is to avoid or sidestep the worst of the selloff and to this point we feel like we’ve largely accomplished that. Not experiencing the same level of downside as the overall market has allowed us to not just play defense, but to go on the offensive – searching for ways to add future value. We’ve already been active in harvesting tax-losses and we continue to look for opportunities to reposition portfolios as valuations have become more reasonable and future return prospects have improved.
For more specifics on broad market returns we’ve included our “Heat Map” of returns which highlights just how deep and broad-based the selloff has been over the last quarter and the first six months of the year. As previously mentioned, there have been very few places to “hide”.
Equities
It may be hard to believe, but it’s been just shy of six months since the S&P 500 hit an all-time high on January 3rd. That may be why the last six months have been particularly hard for so many investors. It’s human nature for investors to focus on the current value of their portfolio versus two data points – where it started the year and what the previous high point was. In this case, those two data points are nearly identical and both elicit feelings of disappointment.
Bear Market History
On June 13th, the S&P 500 officially entered bear market territory finishing down more than 20% from that high point reached in January. While there have “only” been 11 bear markets since 1950, we’re a mere two years removed from the one caused by the pandemic. The current selloff, however, seems destined to take a very different path. In 2020, everything happened in a record short period of time as the S&P 500 reached bear market territory in a matter of 33 days and took only 148 days to recover and set a new high. The current selloff has already lasted 178 days and still sits very close to its current low point.
No two bear markets are ever the same, but as we look at the reasons for the current selloff, it is not all that surprising that it’s following a different path. Investors today are confronted with high inflation and tightening monetary and fiscal forces, whereas the pandemic period could be characterized by deflation and very easy monetary and fiscal policy.
We believe equity markets today are adjusting to a current reality, as well as a potential reality (More from a previous communication here). The current reality is that inflation pressures are likely to be with us for some time and history has shown us that higher levels of inflation lead to lower equity valuations and prices. The potential reality relates to the Fed’s fight against inflation and whether that pushes the economy into a recession.
“The Recession Everyone Sees Coming”
We aren’t in the business of predicting recessions or economic growth in general, but we will point out that if a recession does occur it won’t be much of a surprise. In fact, one of our asset managers titled a recent market note as “The recession everyone sees coming.” In our experience, the more expected an event or outcome is the less impact it has on the market because the market had already built the event into current pricing. Whether or not a recession is already baked into stock prices is impossible to know, but the graph on the left shows just how much the Price to Earnings (P/E) multiple for the S&P 500 has already changed. The graph on the right shows the change in P/E multiples across various market segments since the start of the year.


Valuations
Pending recession or not, improved valuations increase our expectations as it relates to long-term, future returns. We continue to look for ways to take advantage of those improved valuations while being cognizant of the likelihood that markets will remain volatile and potentially see more downside before recovering.
Growth vs Value Stocks
One last note on equities relates to the continued divergence between growth stocks and value stocks. We cited this as one reason our typical equity portfolio has done better than its global benchmark. As the following illustration shows value has outperformed growth by a meaningful amount year-to-date regardless of company size or geography. Given the magnitude of the outperformance we did slightly reduce our overweight to value in portfolios, but overall still remain overweight and believe that value stocks represent the more attractive of the two styles.

Fixed Income
Fixed income investors have occasionally had to endure short periods of small losses, but nothing like what they’ve experienced the past six months. Persistently high inflation has forced the Federal Reserve (the Fed) to become more aggressive in its actions and led to a paradigm shift in fixed income returns. As our illustration shows, rates have risen quite a bit in a very short period of time which has led to sharply negative returns. In fact, as the graph in our Markets Overview section showed, the last six months ranked as the second-worst six-month period(1) going all the way back to the index inception in 1976.

As we discussed in a recent video communication, fixed income has enjoyed a four-decade long period of consistently positive (and often strong) returns. The abrupt change over the last few quarters has for the first time left many investors scrambling to better understand their bond portfolios and how much risk they are taking with their “safe” money.
Temporary vs. Permanent Losses
When it comes to fixed income it’s important to differentiate between temporary losses (often called mark-to-market) and permanent losses. It’s an important distinction because absent a credit impairment or company default, losses in fixed income are typically temporary. Like stock prices, bond prices and returns move up and down every trading day. Unlike stocks though bonds have a final maturity date and price that is fixed. At maturity, all of the bond price movement during the life of the bond becomes irrelevant as all that matters is the final maturity value – something that is spelled out when a bond is first issued or available for sale. As a result, while an investor may experience both positive and negative returns during the time they own a bond, the overall total, cumulative return does not change and is “set” when a bond is purchased.
Market Movement and the Fed
Another point we’ve made before is that markets anticipate or move in advance of Fed activity. Nobody knows with certainty what the Fed is going to do in the future, but the Fed does attempt to communicate their plan, which allows the market to build future rate hikes into current prices. This means that while the Fed may not be finished hiking interest rates, that doesn’t necessarily spell doom for the bond market and future returns. For more on the topic please watch this video.
We entered the year with a defensive posture in investor portfolios, including within fixed income. Our focus is always on valuations and we believed bonds to be expensive and a poor risk-to-reward proposition for investors. While many investors stretched for yield, we took what we believe is the patient, cautious – and better approach: owning shorter-maturity, high credit quality bonds. Like all bond investors we’ve experienced losses in our portfolio, but fortunately our portfolios have performed notably better than the broad market and benchmark due to that defensive positioning.
Given the sharp move higher in interest rates year-to-date, we have started to adjust our positioning. On average, we still own bonds with a shorter maturity than the overall market or benchmark, but we have started to narrow the gap. We’ve also begun to take on more credit risk, as widening credit spreads have resulted in overall bond yields that we find increasingly attractive. We wouldn’t characterize our positioning as aggressive by any stretch of the imagination, but we are methodically becoming less defensive. Like others, we expect the Fed to continue to be aggressive in their fight against inflation, but we believe much of that may already be priced in.
Commodities + Real Assets (+ Alternatives)
Our objective in this section of Your CFO Report is to provide commentary on asset markets other than traditional stocks or bonds. That has typically meant commodities or commodity-related securities (MLPs or Energy Pipelines) and real estate (REITs). Since our “Heat Map” in the Market Overview section details commodities and real asset returns, we will focus here specifically on how we’ve allocated capital outside those two traditional asset classes. To view specifics on market performance year-to-date, view our chartbook here.
Alternatives
The recent market environment has helped investors understand the importance of having investments that are not necessarily correlated (move in the same direction as) with traditional stocks or bonds. That is a message we’ve been vocal about over the years as we’ve advocated for investors to include Alternatives or Alts in their portfolio – especially when traditional markets appear to be expensive. That wasn’t always a popular message or position to take, but this year it’s been vital to our success in avoiding some of the downside.
Selling Up, Buying Down
Our typical Alternatives portfolio consists of five holdings – two trend-following managed futures strategies, one energy pipelines strategy, and two global macro strategies. While two of the strategies have had negative returns this year, they have all outperformed their respective benchmarks and even more critically the collective return has been positive. It’s important to note that during March we did start to reduce our allocations to managed futures and the energy pipelines in favor of adding to equities. Having these positions that had performed well this year gave us the ability to sell something that was up to purchase something that was down and had reached levels we found to be attractive.
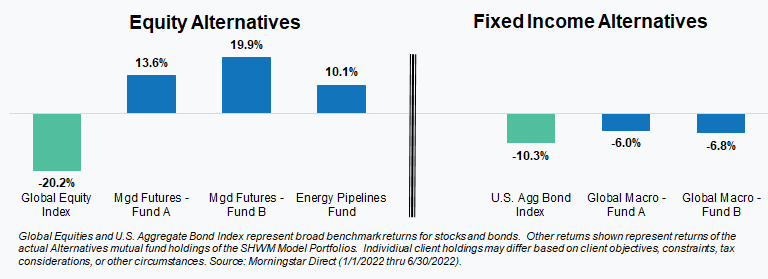
There is never a guarantee that we’ll see similar results from Alternatives during every market selloff, but we did construct our Alternatives portfolios with a focus on strategies that 1) have low correlations with traditional stocks and bonds and 2) a history of performing well during difficult periods. There are many strategies that are categorized as Alternatives, but few fit the description of what we are looking for. Managed futures and global macro are two that do.
Managed futures at times has even been called a “Crisis Alpha” strategy due to its low correlations and history of performing well during prior difficult markets.
Our approach to Alternatives stands somewhat in contrast to what we are seeing today from other advisors and investors. While we’ve begun reducing our allocations, money has started pouring into alternative strategies which was highlighted in a June 29th Wall Street Journal article titled “Liquid Alt Funds Head for Record Inflows”. We are all for investors incorporating Alts into their portfolios, but for the right reasons (diversification) and at the right time (when traditional markets are expensive). Adding them now looks and feels more like “chasing the hot dot” or “closing the barn door after the horse is already gone”.
As we’ve written throughout, we know what matters to investors at the end of the day is the bottom-line. We understand and appreciate that. We can’t know or say when, but markets eventually will recover and portfolios along with them. Like you, we anxiously look forward to that day!
As always, our team of advisors is available and ready to answer your questions on these or other topics related to investments and financial planning. Please call us at 404-874-6244 or email us here.
(1) measured over consecutive calendar quarters
Unless stated otherwise, any estimates or projections (including performance and risk) given in this presentation are intended to be forward-looking statements. Such estimates are subject to actual known and unknown risks, uncertainties, and other factors that could cause actual results to differ materially from those projected. The securities described within this presentation do not represent all of the securities purchased, sold or recommended for client accounts. The reader should not assume that an investment in such securities was or will be profitable. Past performance does not indicate future results.

 Back to Insights