Returns for the final quarter of 2021 in many ways resembled what investors experienced for the majority of the year – impressively strong equity and commodity markets and flat to negative returns for fixed income. Fortunately for investors, strength in equities and other risk-oriented strategies were more than enough to offset any lack of return in the world of fixed income. At the end of the day (or in this case, year) investors were again able to enjoy positive portfolio growth in spite of new COVID variants, surging inflation, and uneven global economic growth. The past year has been just another example that as the saying goes “markets climb a wall of worry”.
Equities
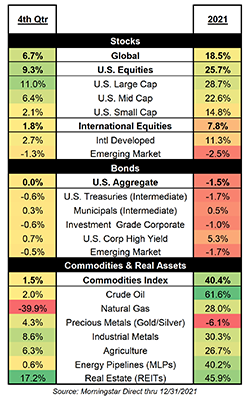
After a lackluster 3rd quarter, equities resumed their march higher during the 4th quarter, with many indices finishing at or near all-time highs – at least in the U.S. Global equities advanced 6.7% during the period with U.S. markets again leading the way. Within the U.S. markets Large Cap companies were the clear winners as the S&P 500 outpaced other segments with a gain of 11.0%. International stocks, both developed and emerging, struggled during the quarter as the Omicron variant and resulting lockdown measures impacted markets unevenly. Developed International stocks were still able to advance, but Emerging Markets continued to be dragged down by Chinese equities. For the year, Chinese equities fell more than 24% while an Emerging Markets ex-China index gained 9.7% for 2021.
The outlook for equities remains challenged despite a slight improvement in several valuation metrics year-over-year. Impressive gains in stock prices were outpaced by even stronger earnings growth as companies continued to benefit from the economic reopening and favorable year ago comparisons. Despite a slight improvement, equity valuations overall remain elevated and at levels rarely matched outside of the tech bubble. That doesn’t mean equity investors are in imminent danger or that we expect a selloff. High valuations can exist for extended periods of time and while they may eventually deter investors, the more likely scenario is that markets will get tripped up by some other unpredictable dynamic – war, natural disaster or a global pandemic, for example. Only then does valuation typically come into greater focus.
What might trip up markets next? As the pandemic hopefully taught us, it’s impossible to be certain, but as discussed in our video segment this quarter, we continue to watch inflation and ponder what persistently high or sticky inflation might mean for investors.
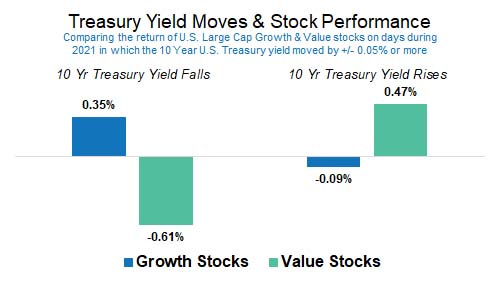
Economic and earnings growth may get the bulk of headlines when it comes to equities, but changes in interest rates can also have a material impact on returns. One interesting example this past year compares the performance of growth and value stocks on days in which the 10-Year U.S. Treasury bond yield changed by 5 basis points or more. That may not seem like a significant move, but as our graph shows it caused quite the tug of war in performance between large cap growth and value stocks here in the U.S. Falling rates propelled growth stocks to meaningfully outperform on average while rising rates benefitted value stocks. Stocks may normally be directionally correlated, but not in this case. Changes in interest rates and bond yields weighed heavily in determining not just which segment outperformed, but also in whether its performance was positive or negative on a given day.
Fixed Income
After a flat quarter, the primary fixed income benchmark in the U.S. (Bloomberg BarCap US Aggregate Bond Index) will finish 2021 with only its 4th calendar year loss in the last 40 years. The full year loss of 1.5% can be solely attributed to a difficult 1st quarter in which the index fell 3.4%, itself a rather noteworthy result as it was the worst quarterly return since 1981. The past year may not have been positive for bond investors, but it has been a good reminder that a poor year in bonds typically pales in comparison to what can happen when equities perform poorly.
Bond prices and returns generally move in the opposite direction of bond yields so negative fixed income returns would indicate that yields rose during 2021. The 10-Year U.S. Treasury bond rose from just 0.93% at the end of 2020 to 1.52% at the end of 2021. Obviously not a large nominal move, but with total yields at such low levels it doesn’t take much of a negative change in bond prices to overwhelm the coupon interest an investor receives. Fortunately for some bond investors, returns in municipals and high yield bonds were able to generate positive returns for both the recent quarter and the full year.
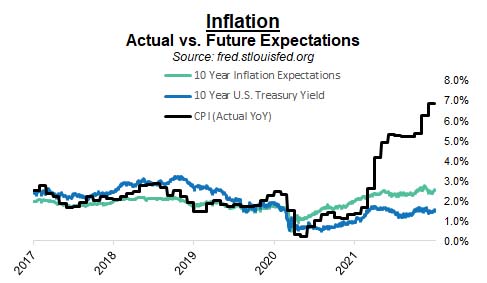
The outlook for bond investors marginally improved during 2021 due to the move higher in bond market yields. Despite the increase year-over-year in yields, they remain quite low and questions abound about how much higher they may still go and when. The answer to that will likely be determined by whether inflation remains elevated. As our illustration shows, inflation (CPI) has surged over the last year, yet bond yields and inflation expectations have only nudged higher. Should inflation remain sticky or even fall slower than the Federal Reserve and other central banks expect, then the Fed will likely be forced to raise interest rates. Those actions would likely push overall yields higher and negatively impact bond prices.
Commodities + Real Assets
Commodities capped off a remarkable 2021 with another positive quarter. In fact, the broad index has now been positive for seven consecutive quarters. Returns for the most recent quarter may have been relatively modest, but one commodity, natural gas, continued to experience remarkable volatility. After moves of +30.3% and +58.7% during the last two quarters, natural gas plummeted 40%. Full year returns saw most major commodity categories, including natural gas, surging higher. The lone exception was Precious Metals (primarily gold) which fell 6.1% giving up some of its stellar 2020 gains. Real assets, represented in our table by Energy Pipelines and Real Estate Investment Trusts, also enjoyed strong returns for the full year.
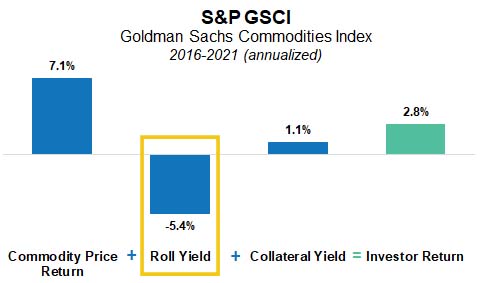
Investing in commodities for the average investor is fundamentally different than investing in bonds or stocks. Commodity investing entails the use of futures contracts to gain the desired commodity exposure. Unbeknownst to the average investor, however, is that the use of futures contracts also means exposure to things like “roll yield” and “collateral yield”. Digging into roll yields and collateral yields is a topic for another day, but in thinking about and understanding commodities returns, an investor should know that their return will equal the commodity price changes + roll yield + collateral yield. While the collateral yield is typically a positive contributor to returns, the commodity price change and the roll yield can be either positive or negative.
In fact, over the last five years, the roll yield has been decidedly negative and a meaningful detractor from investor returns. This magnitude of impact isn’t especially unique. In a recent white paper by one of our asset managers, they discussed the period from 1970 to 2000 in which investors enjoyed an 8% per year real return due entirely to the roll yield and collateral yield. During that same period the commodity price change component lost 2% real return per year! Roll yields and collateral yields matter quite a bit in determining the actual returns an investor achieves.
We would advise investors to proceed cautiously in using commodities as an inflation hedge. Yes, commodity investors did well in the late 1970’s and early 1980’s when inflation last caused concerns in the U.S., but the driver of those returns wasn’t what one might have expected (i.e. it wasn’t the prices of the underlying commodities). Commodities may again provide an effective hedge, but investors should not be quick to assume history will simply repeat itself.
As always, each advisor at Smith and Howard Wealth Management is available and ready to answer your questions on these or other topics related to investments and financial planning. Please call us at 404-874-6244 or email us here.
In our video segments this quarter, we continue our conversation on inflation and what is happening from a big picture standpoint. Click here to access each video.
For those that are more visual and like getting into the details, we’re also introducing our “chartbook” this quarter. Click here to access market-related charts that we think help tell the story of what happened over the course of 2021 in various markets and what current valuations suggest for future returns.
Unless stated otherwise, any estimates or projections (including performance and risk) given in this presentation are intended to be forward-looking statements. Such estimates are subject to actual known and unknown risks, uncertainties, and other factors that could cause actual results to differ materially from those projected.The securities described within this presentation do not represent all of the securities purchased, sold or recommended for client accounts. The reader should not assume that an investment in such securities was or will be profitable. Past performance does not indicate future results.
Want to get insights right to your inbox?
Subscribe to our newsletter to get inside access to timely news, trends and insights from Smith and Howard Wealth Management.
 January 7, 2022
 Back to Insights