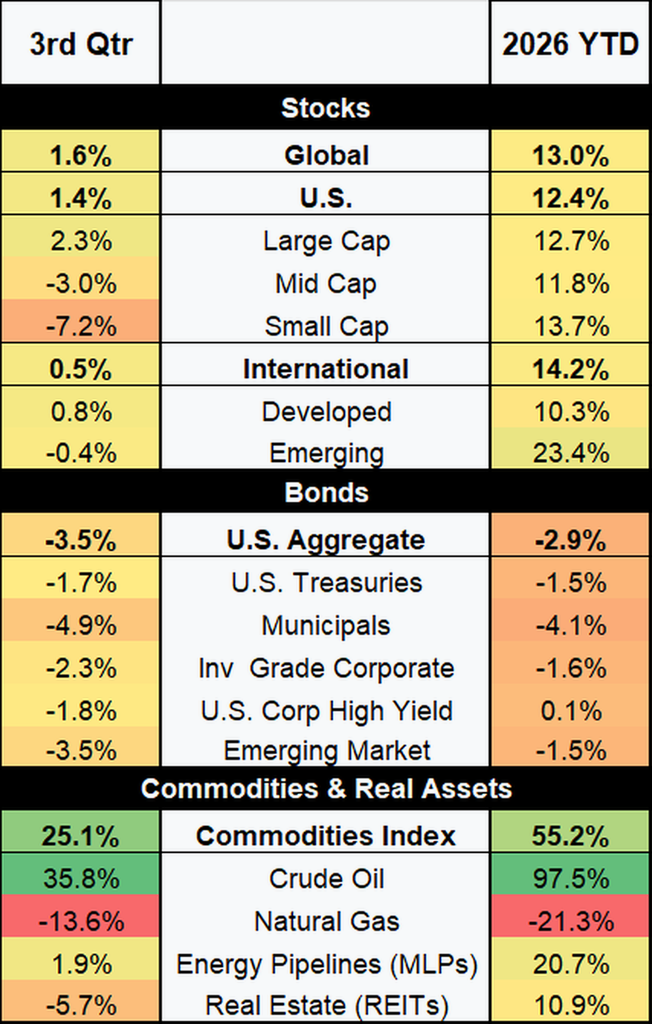
Investor portfolios have enjoyed mostly positive returns in 2026, largely as the result of double-digit returns from equities. Bonds, meanwhile, have lagged—though until recently their contribution to portfolio return had remained modestly positive. Unfortunately for bond investors, that narrative began to shift in early August and continued into quarter end.
Even as global bond yields rose through the first half of the year, the move was largely orderly, with limited volatility and spillover into other areas. Over the past two months, though, that pattern gave way to a much sharper, volatile move higher in yields that left bonds in negative territory and gave investors flashbacks to 2022 (when bonds were down 13%).
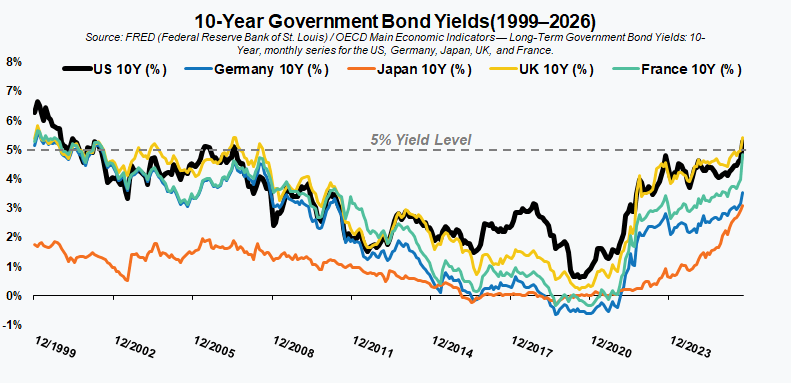
While many investors have speculated that the move higher in yields was a U.S.-specific phenomenon, that was not actually the case. As our graph below shows, the yields of most government 10-year bonds are highly correlated and that remained the case over the past few months. Even Japan, typically an outlier in terms of the nominal yield on its 10-year, saw a notable move higher. Yields for most major markets now sit at levels not seen on a consistent basis since before the financial crisis.
The move higher in yields has been global, though the drivers have differed. Higher oil prices and geopolitical risk are common threads; in the U.S., resilient growth and sticky inflation are lifting real yields, while in Europe, fiscal policy—or the lack thereof—plays the larger role.
Historically, a sudden and sizeable shift higher in bond yields would have posed a significant challenge for equities. Fortunately for most investors, that has largely not been the case this time. That divergence highlights a growing disconnect: bond investors remain hyperfocused on inflation, deficits and a new normal in interest rates, while equity investors remain fixated on economic growth and corporate earnings – both of which have consistently exceeded expectations. As a result, equities managed to enjoy gains at a global level, although underlying returns were mixed depending on market capitalization, geography, and style.
Fixed Income – Another New Normal?
Mohamed El-Erian, then co-chief investment officer and CEO of PIMCO, popularized the term “new normal” in 2008 and 2009 to describe an era of slower growth and lower yields following the global financial crisis. Every major shift in yields since—up or down—has revived the phrase, and the recent surge in yields has brought it back once again. Investors and fixed income traders have referred to the recent move as a “new normal” with higher yields rather than a temporary shift that will reverse quickly.
As previously noted, the move higher in yields has had several catalysts and has been a painful near-term experience for investors. Yet despite that pain—and despite the fact that bonds suffered a double-digit percentage decline as recently as 2022—investors continue to expect their bond allocations to deliver steady, ballast-like returns. That expectation of stability, along with recent returns, has many investors questioning their allocations and commitment to bonds.
As most experienced investors well know, some of the best investment results come from investing when the outlook feels darkest, not when markets are calm. It can be easy to get fixated on what has most recently happened and lose sight of what those changes mean for the future. Bond selloffs can be painful, but they also reset prospective returns higher.
Rather than anchoring on returns over the most recent quarter or year(s), investors would be better served looking at forward return expectations or returns from the last time yields were at current levels. For example, let’s look at the 10-year U.S. Treasury. The last time it had a yield of 5% or greater was in mid-2007. Over the next five years, the 10-year had an annualized return of 6.9%. Over the same period, the S&P 500 returned just 0.9% on an annualized basis.
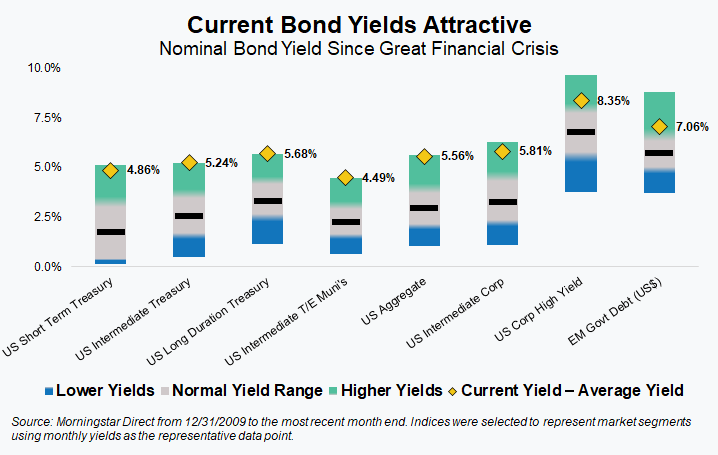
Through that lens, current yields and expected returns for fixed income have become increasingly attractive. Since the financial crisis, yields across major segments of fixed income have rarely been this high.
U.S. corporate high yield and emerging market debt remain exceptions, but even their yields are well above average for the period and have recently become more interesting. On average, they also have higher credit quality than they have historically, so some of that relative difference is warranted.
Equities – Cheaper Despite the Climb
In early September we put out a piece looking at some of the crosswinds impacting equity investors. Since bottoming in late 2022, equity markets have been on a rather historic bull market run. Runs of the current magnitude and length are increasingly viewed as ”long in the tooth” by seasoned investors who know that equity markets don’t rise forever. The longer and further a rally extends, the greater the risk that it’s due for a pullback—a dynamic that only intensifies as valuations get more expensive.
We understand that mindset, and as valuation-oriented investors, we’ve watched that cycle play out predictably time and again: as market returns exceed normal expectations, valuations typically follow, becoming increasingly expensive.
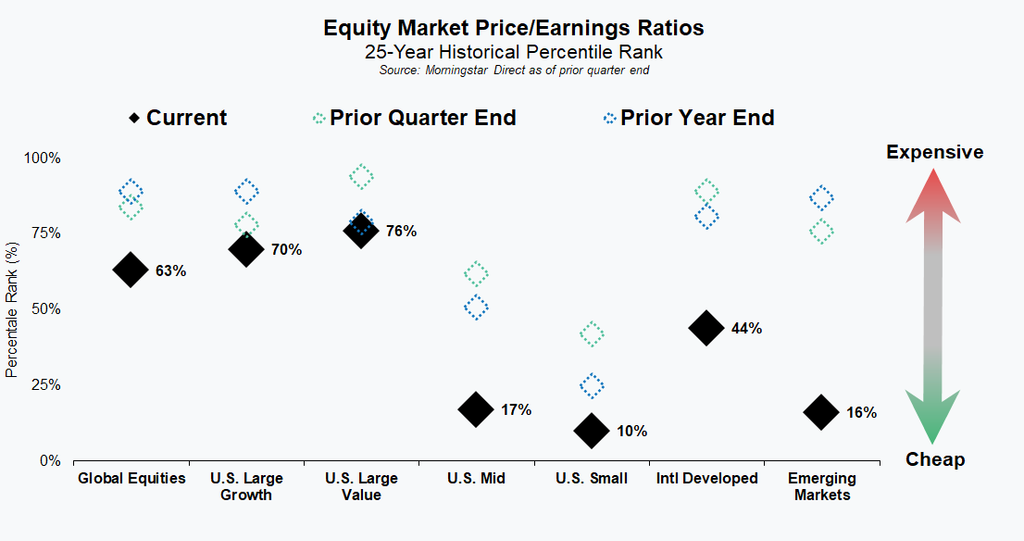
While we don’t believe equities to be overtly cheap, the current cycle is playing out a little differently. As we show in the following graph, equities have actually gotten progressively cheaper throughout 2026 despite above average year-to-date returns.
The chart below tracks equity valuations using each market segment’s price/earnings ratio expressed as a percentile rank against its own 25-year history—that is, where today’s valuation falls relative to every monthly reading over the past 25 years, from cheapest to most expensive (right hand scale).
Each segment shows three points: the black diamond marks the current percentile rank, while the two dotted markers show where that same segment stood at the prior quarter end and the prior year end. A higher percentile (toward the top of the chart) signals a more expensive market relative to its own history; a lower percentile (toward the bottom) signals a cheaper one.
Read this way, the chart shows that equity markets have broadly gotten cheaper, not more expensive, over the past year despite the rally.
The reason valuations have fallen even as prices have climbed is straightforward: corporate earnings have grown faster than share prices. We understand investors’ unease about the equity market given strong returns over the past four years, but, as with fixed income, investors are better served by looking forward, not backward.
Globally, valuations are not excessive, and in most segments they’re becoming more attractive rather than less—a backdrop that supports staying invested rather than growing overly cautious.
Putting it all together, despite strong portfolio returns over the past four years, we remain constructive on prospective returns going forward. Bond yields are meaningfully higher than they’ve been in years, positioning fixed income to once again contribute positively to portfolios, while equities remain reasonably priced and, in most segments, getting cheaper rather than more expensive. That combination gives us confidence that, at least from a valuation standpoint, investors have reason to remain optimistic about the road ahead.
Questions? Contact us.
Markets have given investors plenty to think about this quarter. If you’d like to discuss how current yields and valuations fit into your plan, reach out to your advisor or call us at 404-874-6244.
Want to get insights right to your inbox?
Subscribe to our newsletter to get inside access to timely news, trends and insights from Smith and Howard Wealth Management.
 October 6, 2026
 Back to Insights