The truth or value of something can change completely based on who is looking at it, their perspective, or perhaps their current mindset.
As an independent advisory firm we continuously get inundated with market research and commentary. The vast majority of it isn’t particularly useful. Occasionally, however, we’ll come across something interesting and worth passing along – if for no other reason than it stops and makes one think.
We talk to a lot of asset managers and investors and, as always, there is no shortage of strong opinions on the equity market. Some believe that the equity market is poised to move higher, while others fear that we are overdue for a correction.
One argues the rally is on firmer footing than it looks, built on earnings rather than multiple expansion. The other argues that regardless of what’s driving it, the magnitude and duration of the run itself is now a risk. Depending on which one you’re looking at, both may be correct — and that’s rather the point.
Through a bullish lens: earnings are doing the heavy lifting
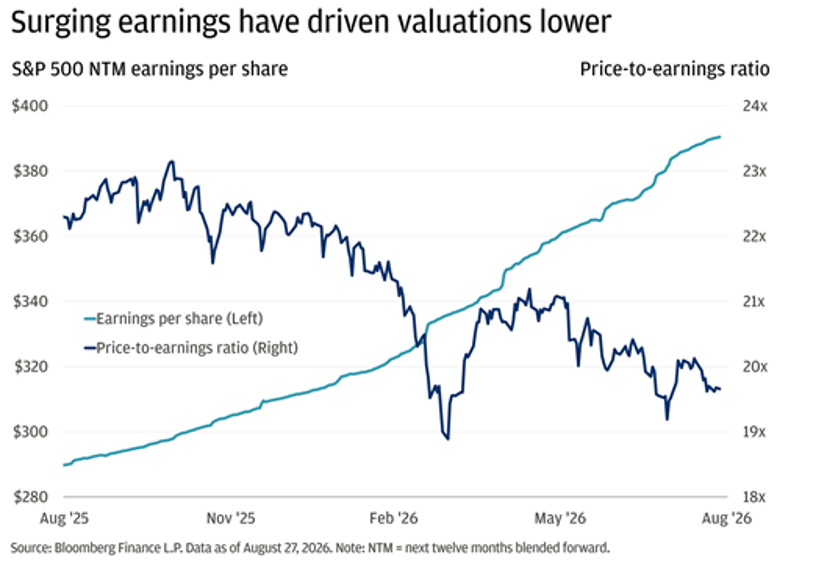
Here’s what the bulls see: since last August, S&P 500 next-twelve-months earnings per share has climbed from roughly $290 to nearly $390, even as the forward price-to-earnings multiple has compressed from about 23x to under 20x. That’s an unusual combination — normally rallies of this length see the multiple do at least some of the work. Here, the index’s advance has been funded almost entirely by earnings growth, with valuation actually becoming cheaper along the way. Earnings-led rallies have historically proven more durable than multiple-led ones, because they don’t depend on the market’s willingness to keep paying more for the same dollar of profit.
Through a bearish lens: the market has rarely run this hot for this long
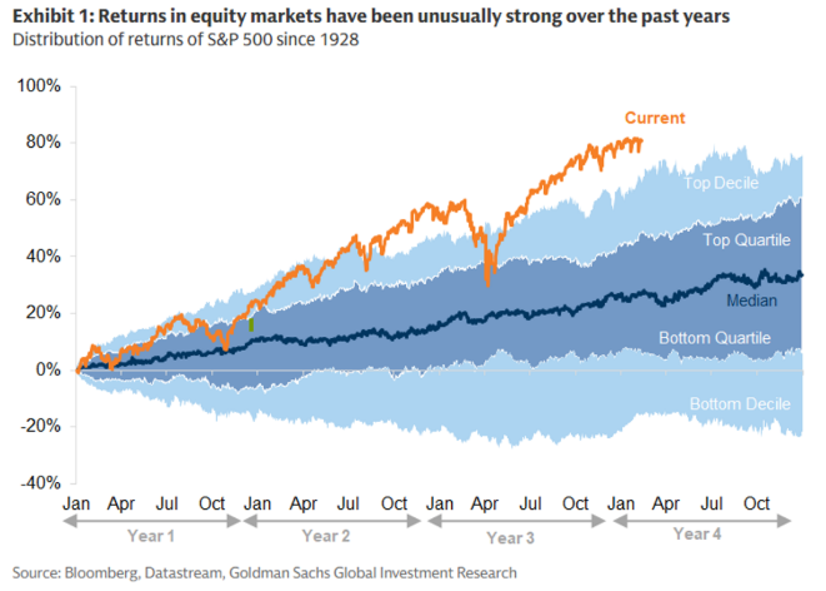
Here’s what the bears see: Goldman Sachs’ chart of rolling four-year return distributions since 1928 puts the current path in perspective: at roughly 70-80% cumulative gain from the start of the window, this cycle is tracking ahead of the top decile of every comparable period in nearly a century of market history. That’s not a valuation call in the traditional sense — it doesn’t say stocks are expensive relative to earnings, as the chart above shows they’re arguably not. It’s a base-rate call: when returns have clustered this far into the top decile before, the market has tended to see below-average or negative returns over the following stretch, simply because such strong, prolonged runs are rare and historically prone to giving some of it back.
Reading both together
In the end, neither chart is wrong — they’re just looking at different things, and which one grabs you probably says as much about your own read on the market (or how you are currently invested) as it does about the market itself. The earnings chart says the fundamentals underneath this rally are sound: this isn’t a multiple-expansion story where sentiment is doing all the work, and that quality matters for how a drawdown, if one comes, would likely unfold. The historical-return chart says something separate: even a fundamentally justified rally can run far enough, fast enough, to pull forward return that would otherwise arrive later, raising the odds of a pause or a give-back regardless of how it got here. Put together, the setup argues for staying constructive on the underlying trend while being realistic that the market has earned a rest — good fundamentals reduce the severity risk of a pullback, but that risk never really goes away.
 September 9, 2026
 Back to Insights