Why Valuation Matters
by: Smith and Howard Wealth Management

August 2017
In my two most recent articles, (Part One and Part Two), the focus was on understanding one of the most commonly referenced valuation measures for stocks, the Price to Earnings (P/E) ratio. This is by no means the only measure of valuation and countless other non-valuation related metrics are used by Wall Street prognosticators. As many have probably heard me say there isn’t a ratio, statistic, or colorful graph that Wall Street can’t create and find a use for! The industry even pokes a bit of fun at itself each January with references to the Super Bowl Indicator. For those that aren’t familiar with it, this particular “superstition” (sorry, I can’t bring myself to call it an indicator!) states that if the AFC team wins the Super Bowl we’ll experience a down market, whereas the market will be up if an NFC team wins.
In all seriousness, there is no shortage of metrics used by the investment industry when discussing why they like or dislike a particular investment. Unfortunately precious few of those metrics have shown any ability to forecast future returns. What works in one period or market cycle typically won’t work in the next. There simply are no perfect forecasting tools or approaches and the moment someone declares they have one (anyone heard the radio spots about gold and silver lately?) it’s probably best to run in the opposite direction! So what is an investor to do? While the temptation might be to turn to that proverbial dart throwing monkey there is one approach and set of metrics that has been shown to be (in statistician speak) statistically significant in explaining variations in returns – valuation (given our recent focus on P/E Ratios and valuations I’m sure you are shocked!). We certainly won’t claim it to be a perfect tool, but investing isn’t about being perfect, it’s about being right more than you are wrong both in frequency and magnitude.
Most serious professionals will acknowledge the importance of valuation in investing, so why the creation and use of all those other metrics? As we’ll illustrate and discuss more momentarily it comes down to time horizon. The reality is that while valuation measures do a good job of forecasting returns over longer periods they are no more relevant than other indicators in the short term. The increasingly short term orientation of investors (and as a result their advisors) creates a need or at least a desire for market timing tools despite the nearly universal acknowledgement that market timing is not just impossible, but destructive.
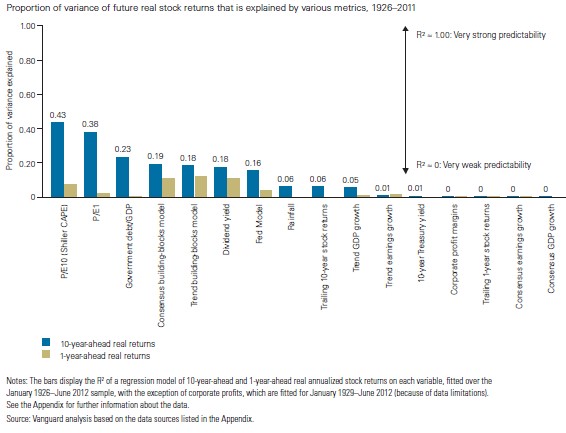
Vanguard produced the following chart that shows the predictive power (or lack thereof) of 15 popular Wall Street metrics and 1 random variable (rainfall) on equity market returns. We’ll save for another day what exactly an R2 means, but to keep things simple, it is measuring in this example how much of the variation in equity market returns can be explained by the stated metric. The blue bar measures returns over a 10-year period and the gold bar a 1-year period. None of the metrics qualify as even remotely relevant on a 1-year basis – again, forget market timing! Over 10 years, however, 2 metrics do show predictive “power” and both are versions of that Price to Earnings multiple we’ve spent so much time on. Valuations matter and frankly it consistently matters more than anything else.

Before we move on completely from the Vanguard chart, did you notice the metric in the middle of the list? Rainfall, which few would ever link to equity market returns, appears to show a greater ability (granted it is negligible) to predict equity returns than many popular Wall Street metrics such as consensus earnings and GDP growth. Like the Super Bowl Indicator, random relationships can appear to exist when clearly they are merely coincidental.
The pushback I almost always get to the valuation argument is how an investor could say that things like economic growth, interest rates, fed policy, etc…..don’t matter. My response is always a bit of a shock to them as I readily admit that those things absolutely do matter. They matter a great deal in the short term and certainly still play a role in the longer run, as well. The issue is that they are more helpful in explaining things in hindsight than predicting or forecasting. While that may help a financial journalist write an article for the local paper explaining the prior day in the market it’s completely unhelpful to an investor or advisor looking to allocate capital. As the Vanguard chart shows and we’ll illustrate in another chart later, valuation is not just helpful in allocating capital, but essential.
Naturally most investment discussions focus on identifying where investors can make the most money. While that sounds like a rather obvious statement it completely skips perhaps the most important consideration for investors – risk. Successful investing is an exercise in balancing the dynamic between risk and reward. Fortunately, valuation measures again serve as an incredibly useful tool in navigating both dynamics at the same time. Said more simply, a low valuation level not only means potentially high return, but also helps limit downside.
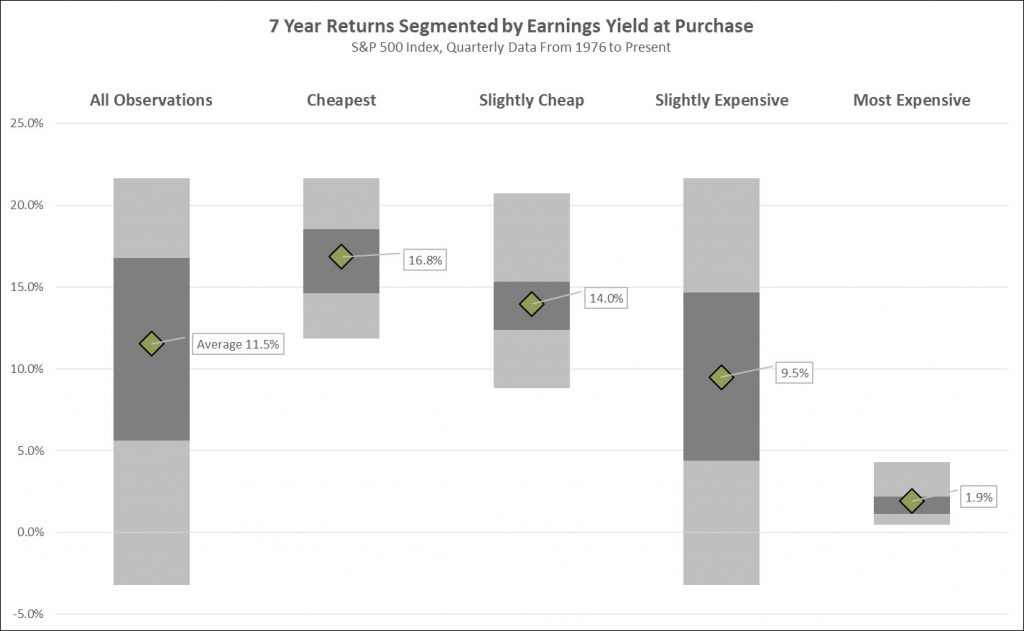
That high return, low risk proposition may sound a bit like fool’s gold since we’ve all been taught that high return accompanies high risk and low return with low risk. Part of that is an issue in how the industry defines risk, but let’s look at a real world example. In the below chart we are looking at rolling, annualized 7 year returns for the S&P 500 by quarter starting in 1976. The first grey bar on the left shows the range of results for all the 7 year observation points (138 of them). The average 7 year return was 11.5% and it ranged from a low of -3.2% to a high of 21.7%. To the right of that first bar we’ve further segmented the returns by looking at the beginning period valuations. Those have been divided into 4 groupings based on the average observed valuation (the inverse of our old friend the normalized P/E ratio which is called the earnings yield) and standard deviations from that average.
As you move from the cheapest to the most expensive bars (left to right) the average 7 year return drops rather significantly (from +16.8% to just +1.9%). The range of returns for each grouping also contain some interesting data. Let’s ignore for now the Slightly Cheap and Slightly Expensive groupings as frankly those groups represent valuations we’d consider within a fair value range of the average (so not extreme). The Cheapest and Most Expensive groupings are starkly different. Both have returns within a rather tight range, but clearly show exactly what a value investor would expect – cheap valuations beget high returns and expensive valuations low returns. The narrow range of returns and minimum returns also help address the risk component, as well. The “risk” in buying something cheaply is that in 7 years your minimum return is still above the All Observations average. While the Most Expensive grouping still shows a positive return in every case the range of returns is an uninspiring roughly 1-4%.

If all this sounds too easy, in a sense it is. Remember the caveat with valuation investing is it requires the proper time horizon. The prior chart showed returns over 7 year periods. If we’d shown it over 1 year periods the same dynamic is still observable, but it’s far less pronounced and the range of returns is extremely wide for every grouping. It’s a little hokey, but I’m fond of saying that valuation works over time, but not all the time. As time passes the predictive power of valuation increases.
Just as with the barrage of news (fake or not) that we see at all hours of the day, there is a temptation that because a statistic or metric exists we must do something with it (again, regardless of any proof it explains or predicts anything). When it comes to investing sometimes the more information we have the muddier the picture becomes. Valuation may indeed be simple, but it’s also intuitive, logical, and most importantly profitable. Which leads me to the below cartoon. Valuation is typically the starting point for most investors, their success often depends on how far off that path (or outside the box) they wander.

Unless stated otherwise, any estimates or projections (including performance and risk) given in this presentation are intended to be forward-looking statements. Such estimates are subject to actual known and unknown risks, uncertainties, and other factors that could cause actual results to differ materially from those projected. The securities described within this presentation do not represent all of the securities purchased, sold or recommended for client accounts. The reader should not assume that an investment in such securities was or will be profitable. Past performance does not indicate future results.

Subscribe to our newsletter to get inside access to timely news, trends and insights from Smith and Howard Wealth Management.