Market Recap: Trade Concerns Briefly Disrupt Market Rally | Second Quarter 2019
by: Smith and Howard Wealth Management
In a nutshell: A mild equity market selloff in May briefly disrupted the market rally that began in late December of 2018. Expectations of a more economically accommodative U.S. Federal Reserve allowed investors to look past the stalled U.S./China trade discussions, as well as data showing slower economic growth. Returns on the quarter were more mixed than the broad strength we saw in the 1st quarter, yet most major stock and bond markets continued to add to their impressive year-to-date returns.
An In-Depth Look at the Market Through June 30, 2019
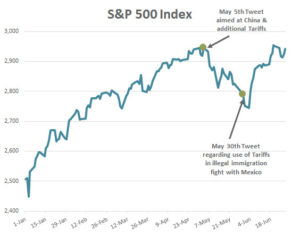
As the chart on the S&P 500 Index shows, equity markets experienced a mild mid-quarter selloff, but ultimately ended the period near record highs. After a strong 1st quarter, risk assets and equity markets in particular continued to push higher into early May.That changed the weekend of May 5th after a tweet from President Trump related to the ongoing trade negotiations with the Chinese. President Trump indicated that not only had talks with the Chinese broken down, but that he was prepared to enforce new, additional tariffs. Markets predictably reacted negatively, but eventually stabilized and began a recovery that lasted through quarter end.
The rally experienced in late May and through June was likely attributable to increased speculation about what the U.S. Federal Reserve may do during the remainder of 2019. The Fed in March had downgraded its economic projections and reduced its forecast for current year rate increases from two to none. As economic growth showed signs of softening and the U.S. / China trade talks stalled, investors began to speculate that the Fed may even begin cutting rates as early as their June meeting. The Fed ultimately did not change rates in June, but they also did nothing to dispel the idea that their next move could be a cut and it could come as early as July. This speculation pushed global bond yields back to near historic lows and helped fuel a rally in equity markets that left most major markets with impressive year-to-date gains.
Equities
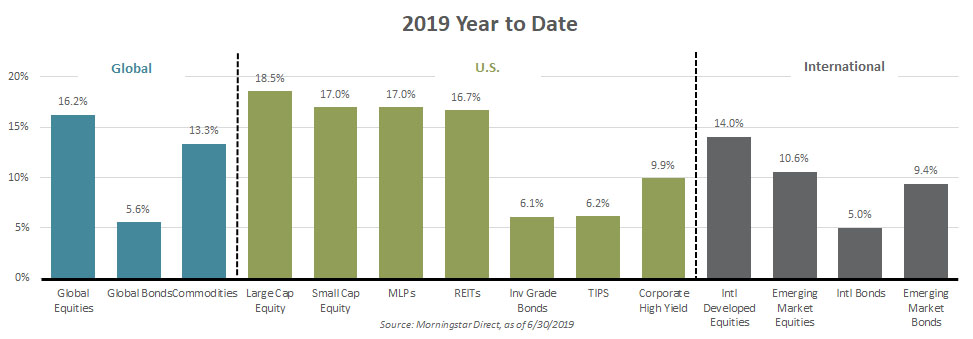
Global equities ended the quarter higher than where they began, but unlike the 1st quarter, it was not a steady climb. Increased tensions with China and softening economic data during the month of May disrupted an impressive string of four positive months for stocks. Despite this step back during May, speculation regarding future fed actions provided a boost to investor risk appetite and equity prices into quarter end.
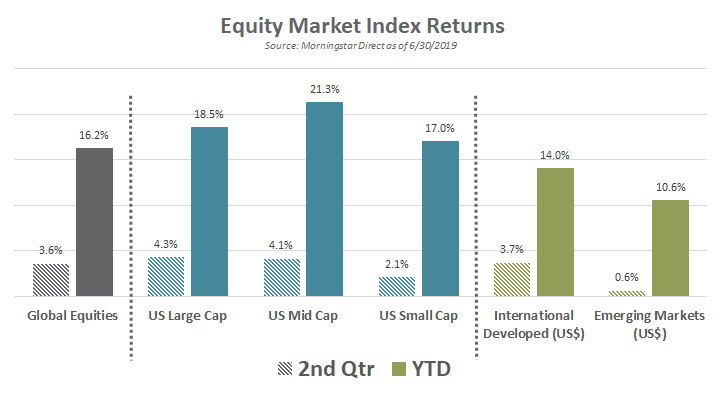
Led again by strength in the technology sector (+6.1%), growth stocks handily outperformed value stocks during the quarter. As the Growth vs. Value graph illustrates, with the exception of emerging markets, this was irrespective of market cap or geography. This is the same dynamic that we observed during the 1st quarter, although we caution investors from reading too much into the returns of any short period of time. To be fair, value stocks had handily outperformed their growth counterparts during the 4th quarter selloff, so are now giving back part of that prior period outperformance.
There is no standard definition of what delineates a growth stock from a value stock, but the industry typically thinks of a growth stock as a share in a company that is expected to grow revenues and earnings at a significantly faster rate than the average company. A couple of current, recognizable examples would be Facebook, Amazon, and Apple. A value stock, on the other hand, is a share in a company that appears underpriced relative to some form of fundamental analysis or metric (dividend yield, earnings, book value, etc…). Johnson & Johnson, Proctor & Gamble, and The Walt Disney Co. are examples of current value stocks. To borrow a quote from one of my favorite authors (Howard Marks) and his book The Most Important Thing “The choice isn’t really between value and growth but between value today and value tomorrow.”
Bonds
The yield on the 10-Year U.S. Treasury moved higher early in the quarter reaching an intraday peak of 2.61% on April 17th. That marked the high point for the quarter, however, as yields began a steady descent that would push yields as low as 1.97% before eventually settling at 2.00% to end the quarter. The 1.97% was a level last seen during late 2016. As previously mentioned, the shift in expectations around future Fed actions was the catalyst for the sizeable drop in bond yields. It is also worth noting that as low as yields appear in the U.S., they are even lower in places like Germany and Japan. Both countries had 10-Year government bonds “yielding” less than 0%!
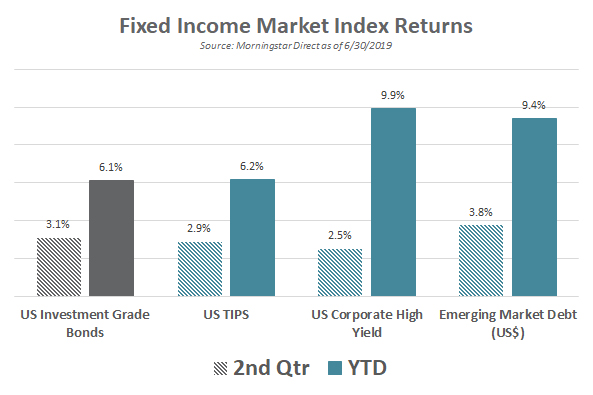
Interest rates and bond yields are inversely correlated with bond prices, so the lower rates resulted in pushing bond prices and returns higher. Positive performance surprises are always a welcome development, but experienced bond investors also know that returns driven by falling yields come with a caveat: lower current or starting point yields mean lower return expectations moving forward.
More opportunistic or credit sensitive areas of the bond market also did well during the quarter, but they did not benefit to the same extent from the drop in government bond yields. Slightly wider credit spreads offset a portion of the gains derived from the falling government benchmark yields.
Real Assets – Commodities and REITs
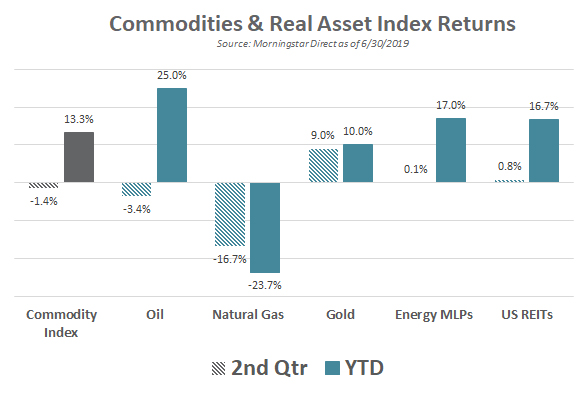
After a volatile and positive 1st quarter, returns in real assets were muted during the 2nd quarter. The broad commodity index (as represented by the S&P GSCI index), crude oil, energy master limited partnerships (MLPs), and U.S. REITs all had quarterly returns of +/- a few percent. Natural gas and gold were exceptions, however, as both had meaningful moves during the period. Muted quarterly returns for much of the commodity complex and real assets masked plenty of intraquarter volatility. Oil, in particular, experienced significant movement with WTI (West Texas Intermediate) crude prices ranging from a low of around $51 to a high of over $66. Tensions with Iran and inventory draws led to a late June rally that returned prices to close to their starting point.
For more information on how trade concerns affected the market or about Smith and Howard Wealth Management’s investment approach, contact Brad Swinsburg 404-874-6244.
Explore more information on the second quarter of 2019 by visiting these links:
Market Outlook: Second Quarter 2019
On the Horizon: Second Quarter 2019
A Deeper Dive: Second Quarter 2019
Unless stated otherwise, any estimates or projections (including performance and risk) given in this presentation are intended to be forward-looking statements. Such estimates are subject to actual known and unknown risks, uncertainties, and other factors that could cause actual results to differ materially from those projected. The securities described within this presentation do not represent all of the securities purchased, sold or recommended for client accounts. The reader should not assume that an investment in such securities was or will be profitable. Past performance does not indicate future results.

Subscribe to our newsletter to get inside access to timely news, trends and insights from Smith and Howard Wealth Management.