ARTICLE
Market Recap + Outlook | First Quarter 2021
by: Smith and Howard Wealth Management
An In-Depth Look at the Markets through year end
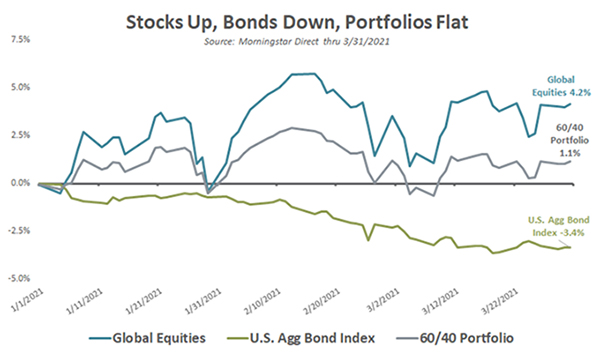
Cut to the Chase: After a year like 2020, in which investors enjoyed solid, if not remarkable, results in the midst of historic economic and social pressures, it would not have been surprising to see markets pause or even give back some of those gains in early 2021. Fortunately for most investors, the first quarter of 2021 saw more of a “pause” than a reversal. Bonds did post modestly negative returns, but conversely stocks spent much of the quarter in positive territory and in most cases were likely enough to keep a balanced portfolio above water.
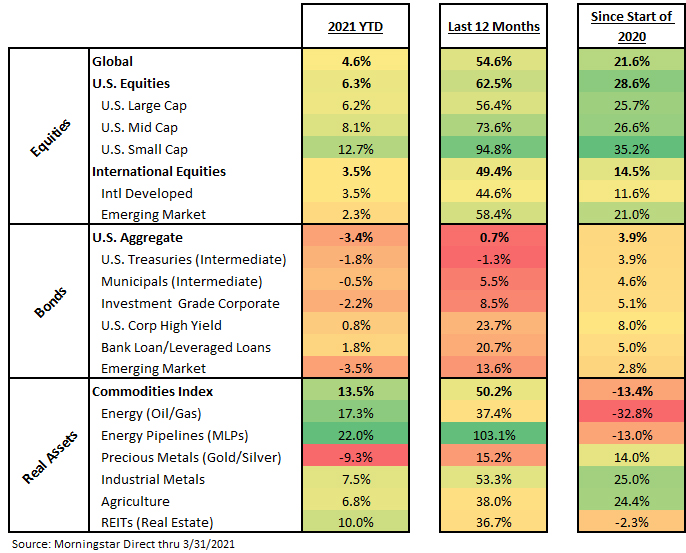
A traditional mix of global stocks and bonds may have produced unexciting portfolio level returns, but that doesn’t mean there weren’t some interesting storylines along the way or below the headlines. As our Heat Map shows, the quarter had a few standouts, most notably Small Caps within equities and Energy prices and Energy Pipelines within commodities. Both continued to rebound off their lows and the under-performance each experienced in early 2020. Precious Metals (primarily consisting of gold), on the other hand, saw modest weakness as investors rotated out after the strong results experienced last year.
Given the historic nature of the last 12-15 months, we also thought it was worth including some slightly longer timeframes for perspective. With the conclusion of the first quarter of 2021, we are now just a few days past the anniversary of the markets’ pandemic low point (March 23, 2020) and the returns experienced since that point have been truly impressive (and welcomed!).
Equities
Recap – Equity returns were again positive, but there were large differences in the magnitudes of returns based on geography, style (value vs. growth) and market capitalization. U.S. equity markets, on the surface, appeared to outperform international developed and emerging markets, but that was primarily driven by the translation of returns back to U.S. dollars. In layman’s terms, the U.S. and international markets performed similarly when excluding the impact of currency for the quarter.
Equity investors experienced more significant impacts from the return differential between value and growth and market capitalization. Both were themes that began to emerge in late 2020 as investors appeared to pivot from the “work from home” theme to the “economic reopening” theme. That pivot was to the benefit of many old-line industries and companies that comprise the value-style orientation. This dynamic was most pronounced in the U.S., but was also evident internationally.
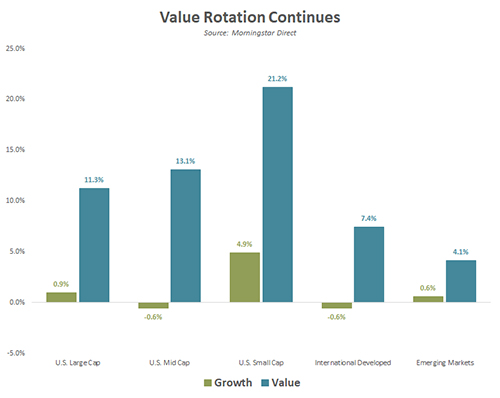
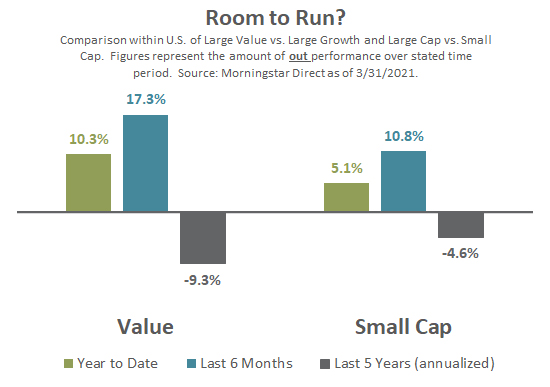
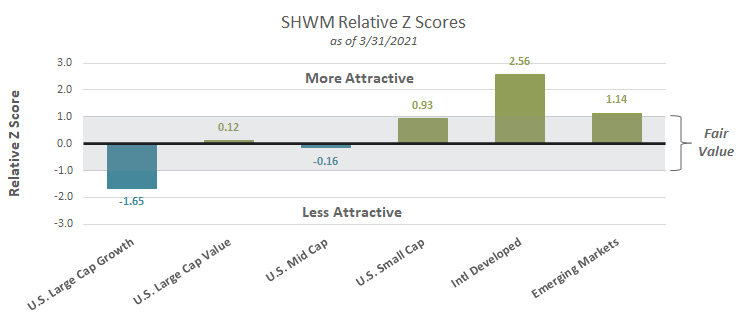
As we enter the second quarter of 2021, we find ourselves asking the same question we did at the outset of the year – will the rotation to Value and Small Cap continue? In the short term, the continuation of this trend is likely to be driven by the pace of the economic recovery, but there is also a longer-term aspect to the question. Despite the recent strong relative performance of both Value and Small Cap stocks, both remain well behind Growth and Large Cap stocks over the past 5+ years. Value and Small Cap, in our estimation, also remain at relative valuation discounts, which could allow the trends to continue.
Outlook – searching for the pockets of opportunity
The numbers may have changed slightly from last quarter, but the story remains the same. Stocks overall remain expensive relative to their own history on most traditional metrics, like Price to Earnings, Price to Book, Price to Revenues and Price to Cash Flows. As we have argued for some time, however, those metrics tell only part of the story. Investors need to be careful about viewing things in isolation. The valuation and attractiveness of other investment opportunities matter – specifically that of cash and fixed income when thinking about stocks.
The chart we shared last quarter (below) again shows two ways to look at the S&P 500. The blue lines (solid and dotted) and the left hand scale relate to the Price to Earnings multiple. The green lines (solid and dotted) and the right hand scale look at the same metric, but also account for the historically low level of cash and bond yields. The blue line shows just how expensive stocks are relative to their own history. The green line, however, shows that relative to bonds, stocks are at a reasonable level or not as overvalued as the first metric suggests.
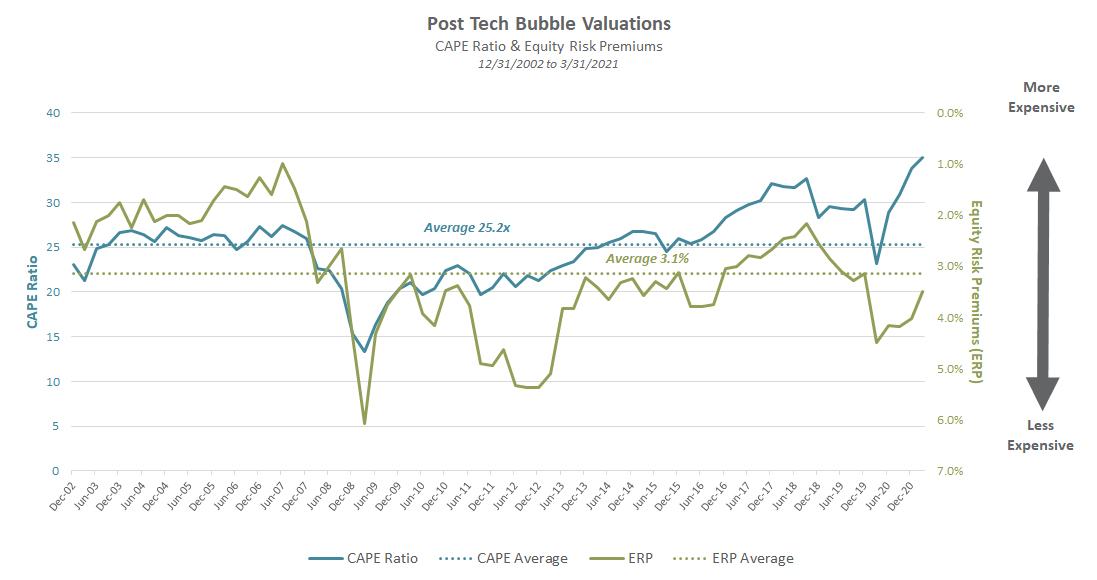
To be clear, we aren’t arguing that stocks are cheap or that investors should ignore the traditional metrics. Both ways of measuring the attractiveness of stocks can be useful, even when they don’t align or perhaps especially when they don’t align – like today. As investors, the blue line tells us that we need to be thoughtful and cautious with our equity exposure, while the green line reminds us why it would be unwise to be too negative or cautious on stocks.
As we’ve consistently pointed out, broad measures of market valuations that focus solely on the U.S. Large Cap market (like the above) may not show all the pockets of opportunity that exist. We believe that investors willing to shift their allocations towards Value, Smaller Capitalization and International stocks are likely to fare better in the long run as those areas continue to have more attractive valuations, both compared to their own history and relative to bonds.
Bonds
Recap – Unfortunately for investors, the most recent quarter broke a string of ten consecutive quarters of positive returns for the Bloomberg Barcap Aggregate U.S. Bond Index. The index, comprised of U.S. government, mortgage-backed and corporate bonds, fell 3.4%. The magnitude of the loss may not seem all that extreme, but amazingly enough it was the worst quarterly result for the index since 1981!
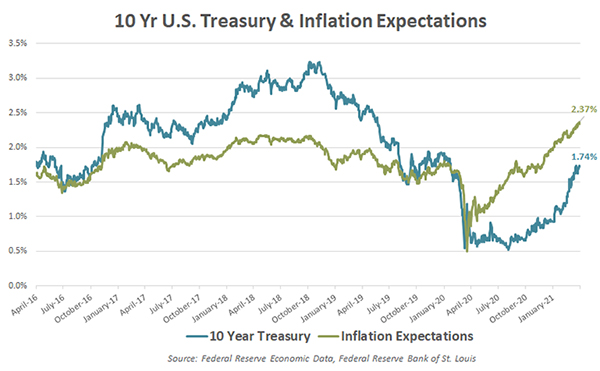
The driver of the negative move was renewed concerns around future inflation. As we wrote last quarter in our On the Horizon: Is Disinflation Over? article, meaningful and sustained shifts in inflation levels in the U.S. have historically occurred in the aftermath of major economic, geopolitical or social events when accompanied by a large government response. The global pandemic and resulting fiscal and monetary stimulus responses certainly fit that description. While we weren’t attempting to call a market or inflation turning point, we also aren’t surprised that the market has started to wonder what the future of inflation may look like.
Not all fixed income suffered losses during the quarter as segments of the non-investment grade markets benefitted from the narrowing of credit spreads. U.S. Corporate High Yield (+0.8%) and Bank Loans (+1.8%) managed to stay positive during the period.
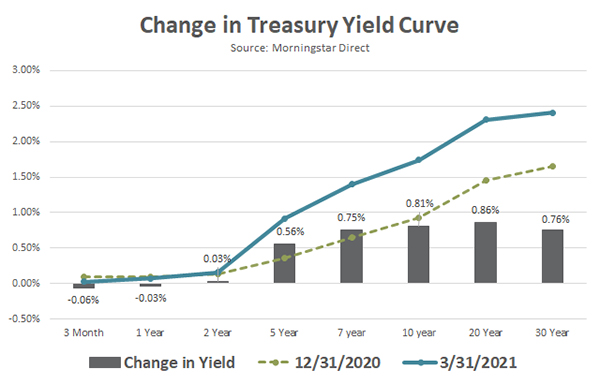
Outlook: The Silver Lining – The selloff in fixed income does come with a silver lining for investors. Since bond prices and yields move in opposite directions, the lower bond prices over the last quarter have pushed bond yields and future returns higher. As the Change in Treasury Yield Curve graph shows, there was little movement in short-term rates but a meaningful move higher for maturities further out on the maturity curve. On a historical basis, bonds remain expensive with unexciting yields, but the last few months have at least marginally improved the outlook for future returns.
The non-investment grade credit portion of the market, something we often refer to as Opportunistic Fixed Income, is one in which we remain active. After cutting our exposure in January of 2020, we used the higher yield levels available in early April of that year to add this exposure back to portfolios. With those bonds surging during the recovery, we have opportunistically been reducing our exposure since the latter half of 2020. We remain constructive on credit fundamentals within the space, but cannot ignore the increasingly expensive valuation levels.
Real Assets
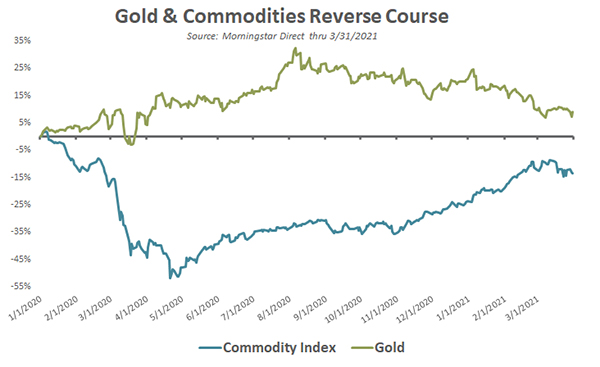
Recap – As with several other major market segments, we saw a continuation of trends from the prior quarter sustained through the most recent quarter. Within our real assets category, that translated into strong returns in Energy prices (+17.3%), Energy Pipelines (+22.0%), REITs (+10.0%) and other commodities in the Industrial and Agriculture realms. The major exception was in Precious Metals (-9.3%), which is primarily comprised of gold (-9.8%). Gold acted as a safe haven for investors during 2020, but the performance differential between gold and a broad Commodities index has narrowed significantly over the last two quarters.
Outlook: A Compelling Valuation Opportunity – At Smith and Howard Wealth Management, we don’t typically invest directly in commodities. Commodities themselves do not pay interest or produce a cash flow, making them difficult to value or invest in directly. We will, however, invest in commodity-related businesses and allow our managers the flexibility to invest in such areas. One area in which we have allocated capital to in the past and retain a stake in today is Energy Pipelines (often referred to as MLPs). Despite their surge the last few quarters, we continue to believe they represent one of the more compelling valuation opportunities in today’s market.
As always, each advisor at Smith and Howard Wealth Management is available and eager to answer your questions on these or other topics related to investments and financial planning. Please call us at 404-874-6244 or email us here.
Unless stated otherwise, any estimates or projections (including performance and risk) given in this presentation are intended to be forward-looking statements. Such estimates are subject to actual known and unknown risks, uncertainties, and other factors that could cause actual results to differ materially from those projected. The securities described within this presentation do not represent all of the securities purchased, sold or recommended for client accounts. The reader should not assume that an investment in such securities was or will be profitable. Past performance does not indicate future results.

Subscribe to our newsletter to get inside access to timely news, trends and insights from Smith and Howard Wealth Management.
 Back to Insights