The third quarter was another positive one for investors with both stocks and bonds finishing higher. There was no shortage of geopolitical news and events the past few months, but there was also very little evidence of that in financial market returns. Returns were broadly positive and the VIX or Volatility Index (sometimes also referred to as the Fear Index) stayed in a rather low, narrow range of 14 to 20 throughout the quarter – after spiking to more than 57 during the April tariff announcement related selloff.
Markets were buoyed by continued solid earnings and expectations that the Fed would begin lowering rates at their September meeting. The Fed ultimately did cut rates by a quarter point (0.25%) and signaled that there could be one to two more cuts before year-end. Historically speaking, cutting rates during a non-recessionary period has typically been a positive for financial asset prices.
The actions of the Fed may take months to be felt or observed in economic data, but financial markets typically react more quickly. As a result, we saw several markets that often outperform during rate cutting cycles do exactly that this past quarter including U.S. large cap growth, U.S. small cap, emerging markets, and gold.
Equities
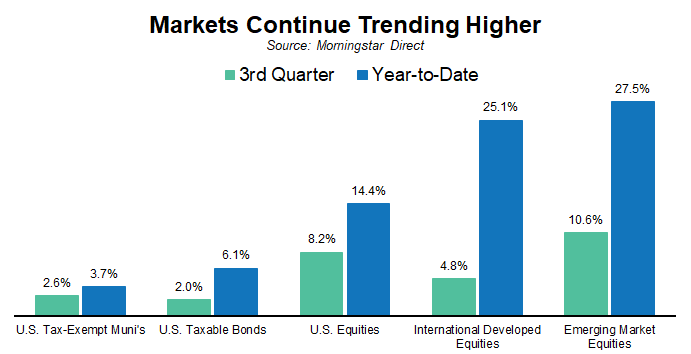
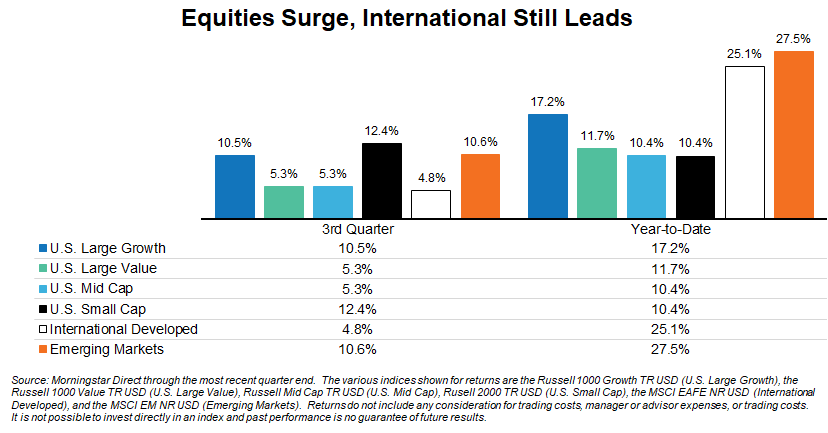
Stocks surged for a second consecutive quarter and the tariff-induced April selloff feels increasingly like a distant memory. Global equities are now up a remarkable 33.6% since the April lows. Compared to the large swings in performance during the second quarter, this past quarter was relatively uneventful. Stocks moved noticeably higher in total, but the monthly returns of +1.4%, +2.5%, and +3.6% weren’t particularly noteworthy on their own.
The story for the year continues to be the outperformance of international stocks, although U.S. stocks have also done well and narrowly outperformed in the most recent quarter. International stocks, both developed and emerging, have nearly doubled the returns of U.S. equities for 2025. We touch on this in one of our videos this quarter, but it’s notable that a lot of that outperformance is due to weakness in the U.S. dollar and how that translates into better returns for a U.S. investor.
One notable outperformer in the U.S. was small cap stocks, which until this past quarter had actually been negative on the year. As noted, this is one of those market segments that tends to do well when the Fed is cutting short-term interest rates. Lower rates reduce their borrowing costs, which are often floating rate and higher than for larger companies.
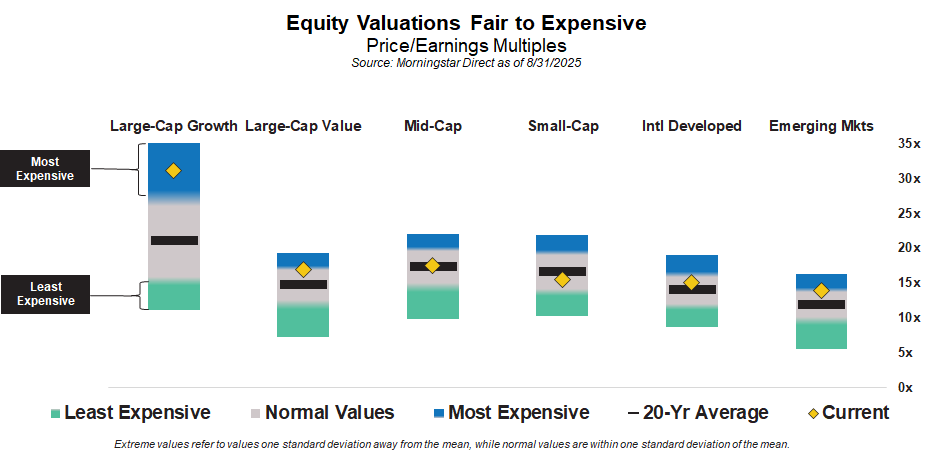
Similar to prior quarter, the magnitude of gains in the most recent quarter would be considered solid for an entire calendar year period. Those types of returns tend to raise valuation levels and, in our opinion, should lower future return expectations. Solid earnings growth and a Federal Reserve at the start of a rate cutting campaign helped markets build positive momentum, but valuations increasingly appear stretched in some segments. Using forward looking earnings projections, U.S. large cap growth and value, as well as emerging markets, now skew expensive (blue shaded area).
Fixed Income
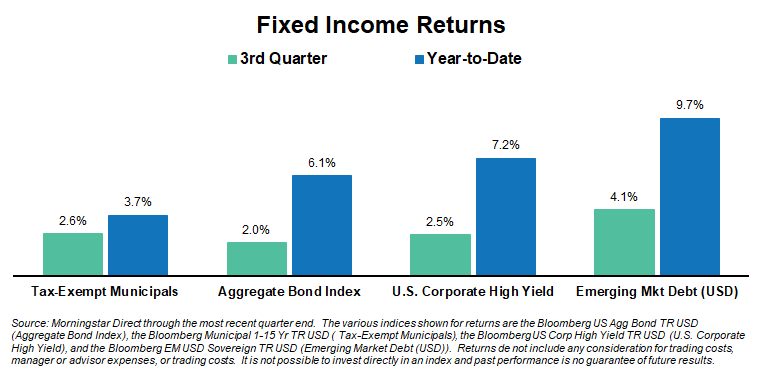
Returns paled by comparison, but bonds were also positive for the quarter. Changing Federal Reserve policy rates and composition are often cause for increased volatility, but as with equities, investors generally looked past those dynamics. Bonds continued to be additive in portfolios and have already returned better than their beginning of year yield’s might have estimated over a full calendar year.
Tax-exempt municipals were a particular highlight during the quarter. Municipals struggled to keep up with other fixed income segments early in the year due to heavy new issuance supply and even some concerns related to their tax-exempt status. We expected they’d eventually recover and close the gap, but sometimes that can take an extended period of time. With strong recent performance, that gap has mostly closed with the nominal return spread for the year closer to historical norms.
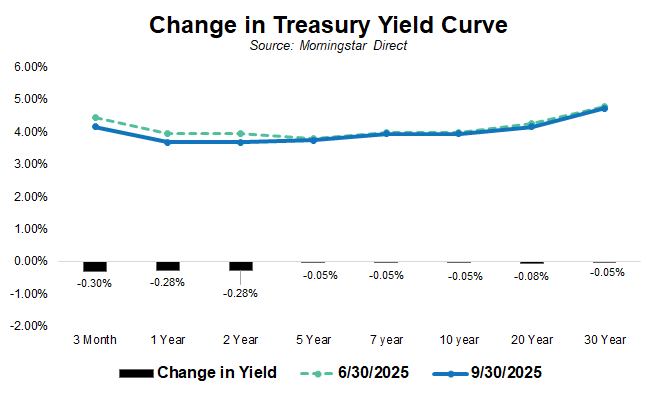
With fixed income volatility low, changes to the yield curve were minimal. That may come as somewhat of a surprise given the Fed’s recent rate cut, but the quarter-point move a few weeks ago had been expected by the market for quite some time. The bigger question has been around how many moves in total the Fed would make in 2025. Even those expectations have been relatively stable and in a tight range (2 to 3 probable rate cuts).
One thing we have been discussing recently with clients is the very real possibility that the Fed’s rate cut campaign changes only the short maturity portion of the curve. The Fed has mentioned a “terminal” short term rate of around 3%. It is quite possible that short rates get there over the next year or two, but that yields for longer dated maturities like the 7, 10, or 20-year maturity stay where they are or even move higher. The Fed can better control what happens to the short end of the curve and if the market believes rate cuts are inflationary it could result in higher long-term rates, not lower.
Taxable or tax-exempt, we still find overall bond yields to be fair. We wouldn’t call them “cheap”, but we believe they are currently a better value on a risk-to-reward basis than equities – although that is more a reflection of increasing valuation levels in equities. One area within fixed income we remain cautious on is lower credit quality strategies, like corporate high yield, where credit spreads remain tight (low).
Commodities + Real Assets +Alternatives
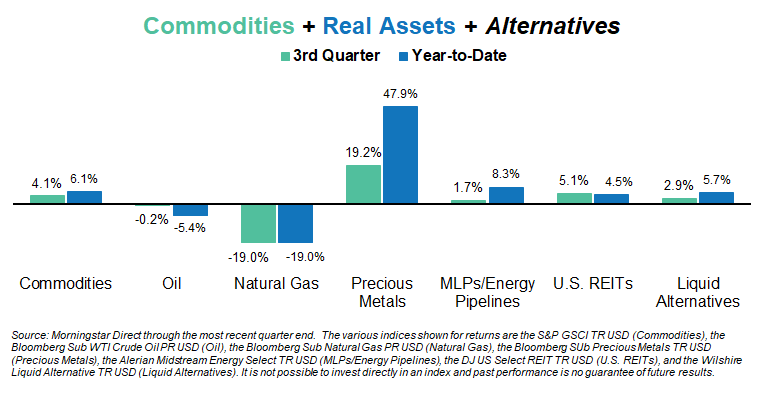
Natural gas and precious metals (specifically gold) were again the big movers for the quarter – albeit in opposite directions. Natural gas is historically cyclical and quite often volatile, so seeing it among top movers (either up or down) is not that uncommon. The move in precious metals, however, has certainly been noteworthy. They were up 19.2% during the quarter and are now up nearly 48% for 2025. A weaker U.S. dollar, continued inflation worries, and rising geopolitical concerns have all been cited as part of the reason for the strength in gold. Another driver that has been a somewhat newer development has been an increased level of demand from central banks, particularly Russia, China, India, and Turkey. These countries have all increased their gold reserves and cited concerns about the stability of the U.S. dollar and a desire to be more diversified.
For clarification purposes please note that our listing of commodities, real assets, alternatives and returns for the period shown is far from an exhaustive list. We’ve chosen to show broad indices or specific strategies because they tend to be areas of interest for investors and/or areas that we own in client portfolios.
Alternatives, or Alts, tends to be a bit of a “catch-all” phrase for the investment or wealth management industry. Typically, things that fall into the Alts category is anything that doesn’t fall neatly into traditional stocks or bonds. The Alts categorization, however, still doesn’t tell an investor much about the correlation those investments have to traditional markets. Some Alts are highly correlated with stocks or bonds, while others are not.
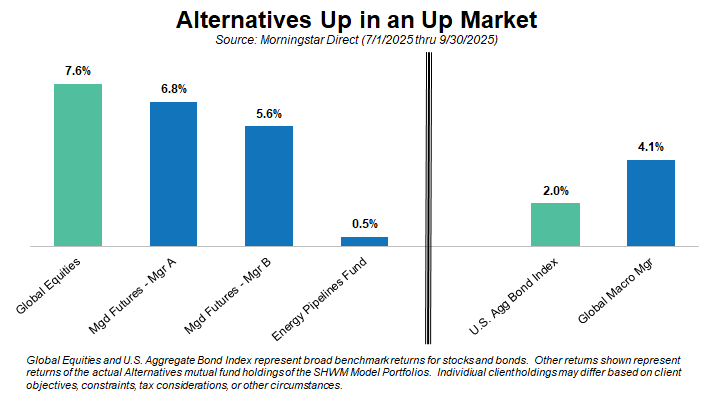
Our approach with regard to alternatives has been to focus on investments that have low long-term correlations to traditional markets. We already have exposure to traditional markets – so what does an investor really gain by adding more? The obvious goal or expected benefit is that uncorrelated investments have a chance of doing well even when stocks and bonds perform poorly. There is never a guarantee, of course, and that applies in the opposite direction, as well. Just because stock and bond markets are up it doesn’t mean that the type of Alts we favor will lose money. This quarter was a good example of that as the illustration shows. The mint green bars represent the returns for traditional markets, whereas the blue bars represent returns for our model portfolio alternatives holdings.
While financial markets have delivered positive results this year, valuations in certain areas have moved higher and policy changes remain an important factor to monitor. If you would like to review how these developments may affect your financial plan or investment strategy, our team is available to provide guidance. An advisor can help assess your current approach, explore potential opportunities, and discuss adjustments that may support your long-term objectives.
Unless stated otherwise, any estimates or projections (including performance and risk) given in this presentation are intended to be forward-looking statements. Such estimates are subject to actual known and unknown risks, uncertainties, and other factors that could cause actual results to differ materially from those projected. The securities described within this presentation do not represent all of the securities purchased, sold or recommended for client accounts. The reader should not assume that an investment in such securities was or will be profitable. Past performance does not indicate future results
Want to get insights right to your inbox?
Subscribe to our newsletter to get inside access to timely news, trends and insights from Smith and Howard Wealth Management.
 October 8, 2025
 Back to Insights