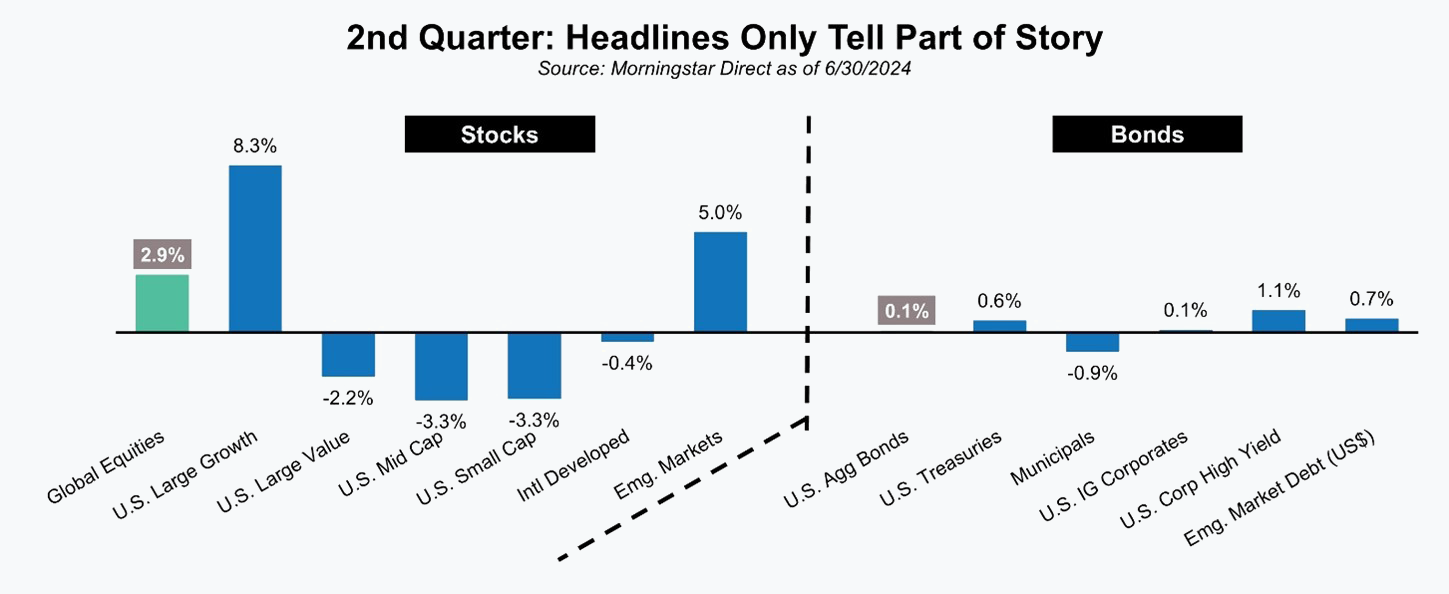
Diversified investors enjoyed a third straight quarter of gains, though they were more muted and not as evenly distributed as the prior two quarters. While bonds just barely managed to eke out a gain, both benchmark indices for stocks and bonds advanced during the quarter.
Stocks were the clear driver of positive results for the period, but as the illustration shows, it wasn’t positive across the board for stocks. In fact, the overall result during the quarter for our global equity benchmark was driven entirely by U.S. large growth and emerging markets stocks (a somewhat odd pairing). In a return to some of what investors experienced during 2023 with the Magnificent 7, a lot of the upside, at least as it relates to the U.S. large growth market, was driven by just a handful of stocks. The most notable is Nvidia, which, in addition to advancing nearly 37% during the quarter also briefly surpassed Microsoft as the most valuable company in the world based on market capitalization.
Whether Nvidia’s $3 trillion market capitalization makes sense is a topic for another time but consider the fact that the only countries with national stock markets worth more were India, Japan, China, and the U.S.!
Bonds, outside of tax-exempt municipals, managed to finish the quarter with marginal gains. Once again, however, the end results or headline figures don’t tell the full story. Bonds spent most of the quarter in negative territory before enjoying a rebound in June. As the quarter progressed, bond markets appeared to settle down after a volatile start to the year due to constantly shifting expectations for what the Fed was likely to do (or not do) during the remainder of the year.
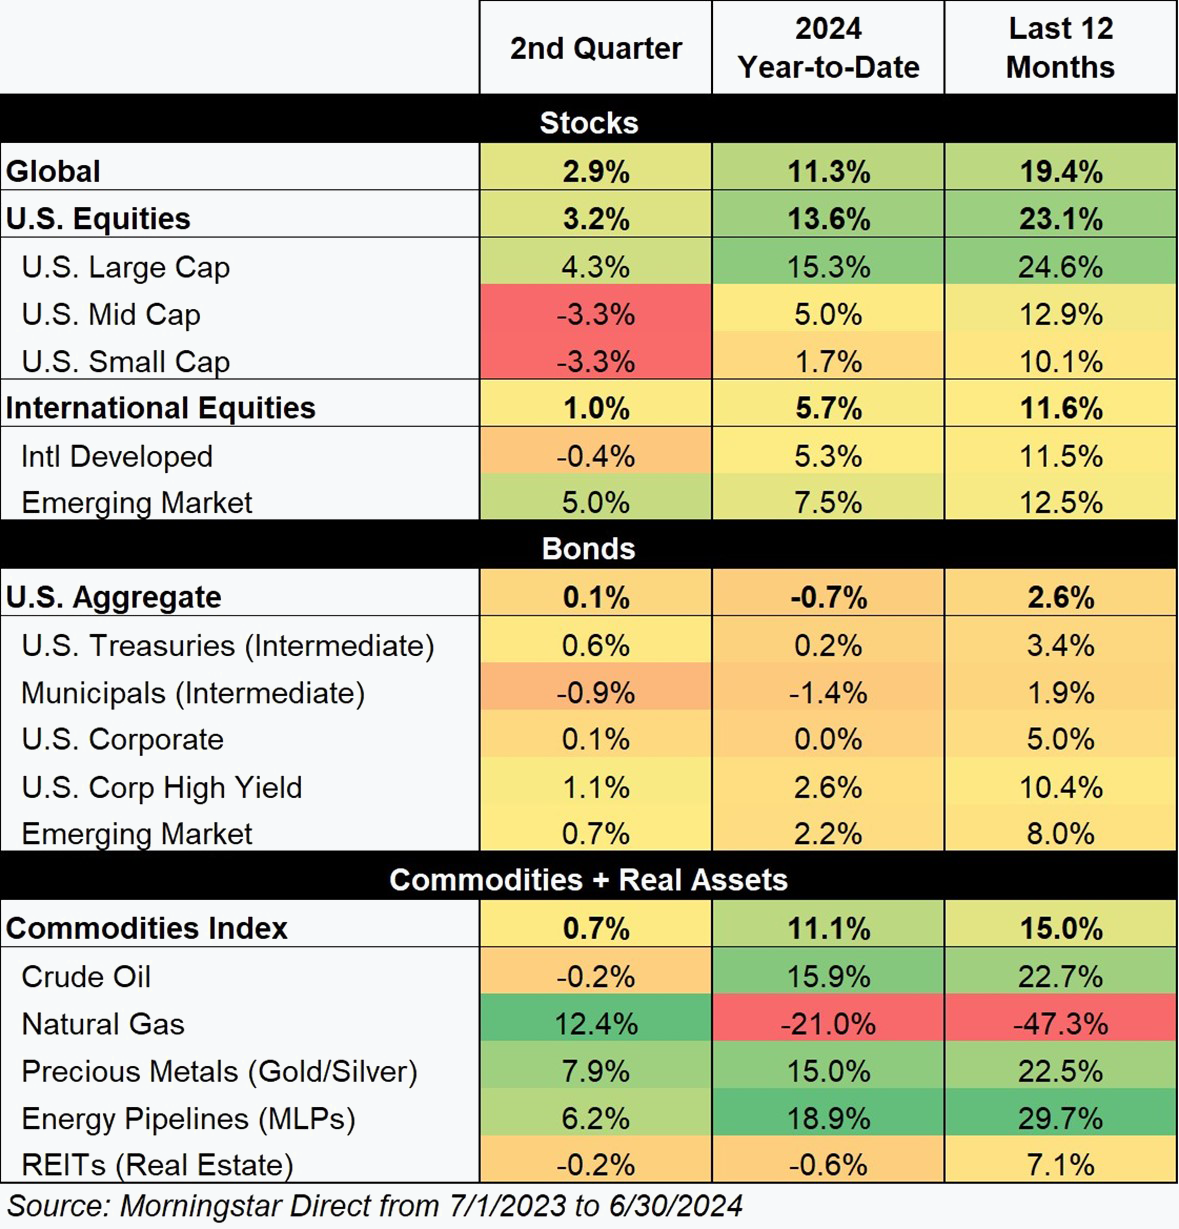
As our market heat map shows, gains in stocks and commodities + real assets added to what were already strong prior periods. Even bonds, when viewed over the past 12 months, have performed positively and contributed to results for a diversified investor.
Equities
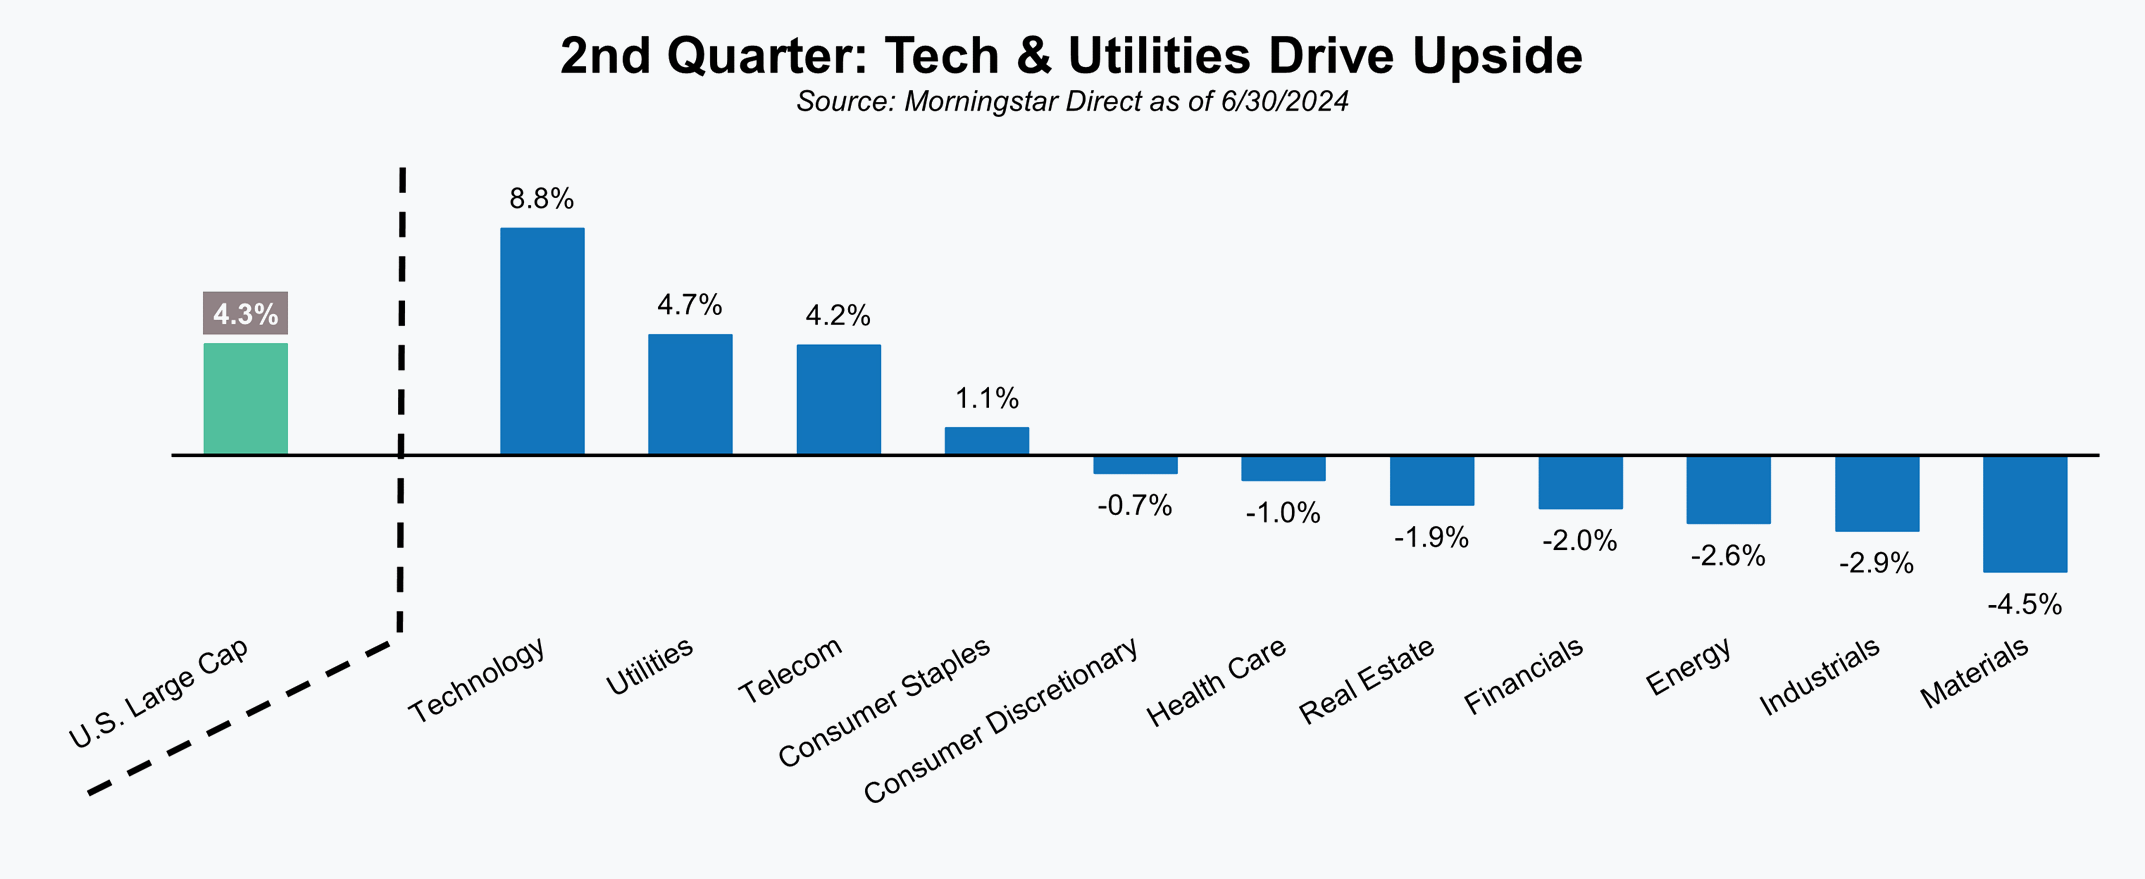
As previously noted, returns across global equity markets showed a significant amount of dispersion. That dispersion theme extended well beyond just major market segments and could also be observed at other levels. Sector returns for the S&P 500, for example, showed considerable differences. The S&P 500 enjoyed a gain of 4.3% for the quarter despite seven of the eleven sectors finishing in negative territory. Strength in Technology, Utilities, and Telecom, fueled in large part by optimism around the impact of Artificial Intelligence (AI), was fortunately more than enough to offset weakness in a large portion of the equity market. Technology has been the obvious AI beneficiary, but that optimism has now also spread to Utilities given the realization of just how energy-intensive AI systems and infrastructure are likely to be. This is a theme we highlighted last quarter and a trend we expect to see more of as investors begin to realize that the benefits of AI extend well beyond a single sector or business type.
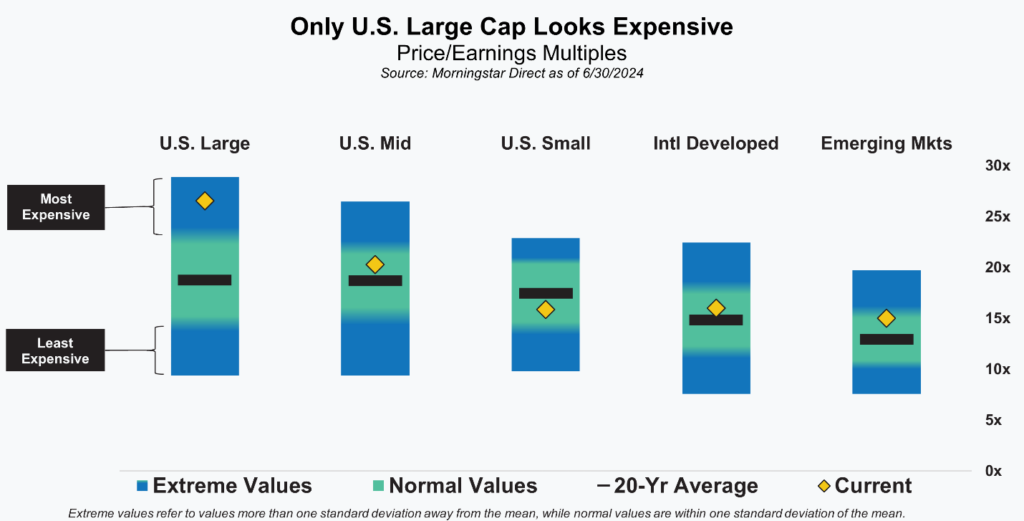
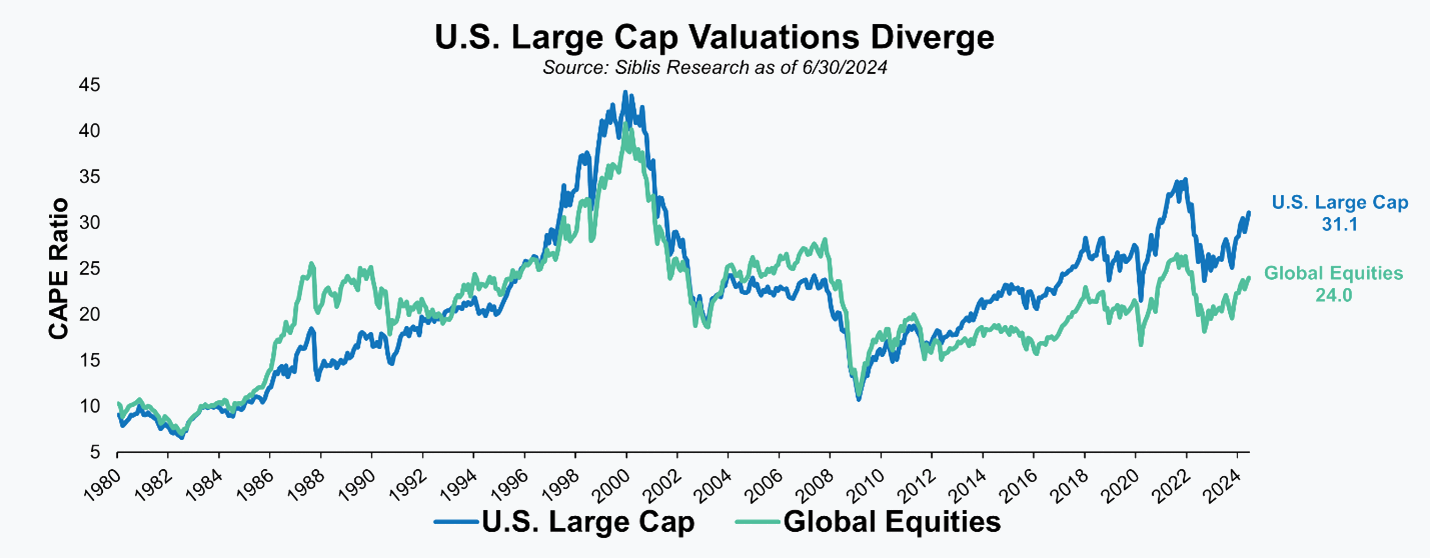
While we understand the enthusiasm around AI, we are less excited about what some of that optimism has done to valuations, specifically in the U.S. large cap segment. Although most market segments have valuations we’d characterize as fair or reasonable, U.S. large cap has become an outlier and not in a good way. Driven primarily by some of the megacap tech names – two of which we referenced in our opening section (Microsoft and Nvidia) – valuations there appear stretched or expensive. Those megacap tech companies may be great businesses with impressive growth rates, but it’s never wise to ignore valuations. Investors who do eventually come to regret it.
Despite some of the elevated valuations we see in the U.S. large cap space, we continue to be constructive on equities broadly. Similar to the prior graph, the divergence shown below between U.S. large caps and the rest of the market is obvious. While valuations for U.S. large cap and the global market track each other closely most of the time, periods of divergence exist and have historically presented opportunities for investors. Today, some of the most compelling opportunities exist in the parts of the global equity market that fall outside of U.S. large cap – namely U.S. mid + small cap, international developed, and emerging markets.
Fixed Income
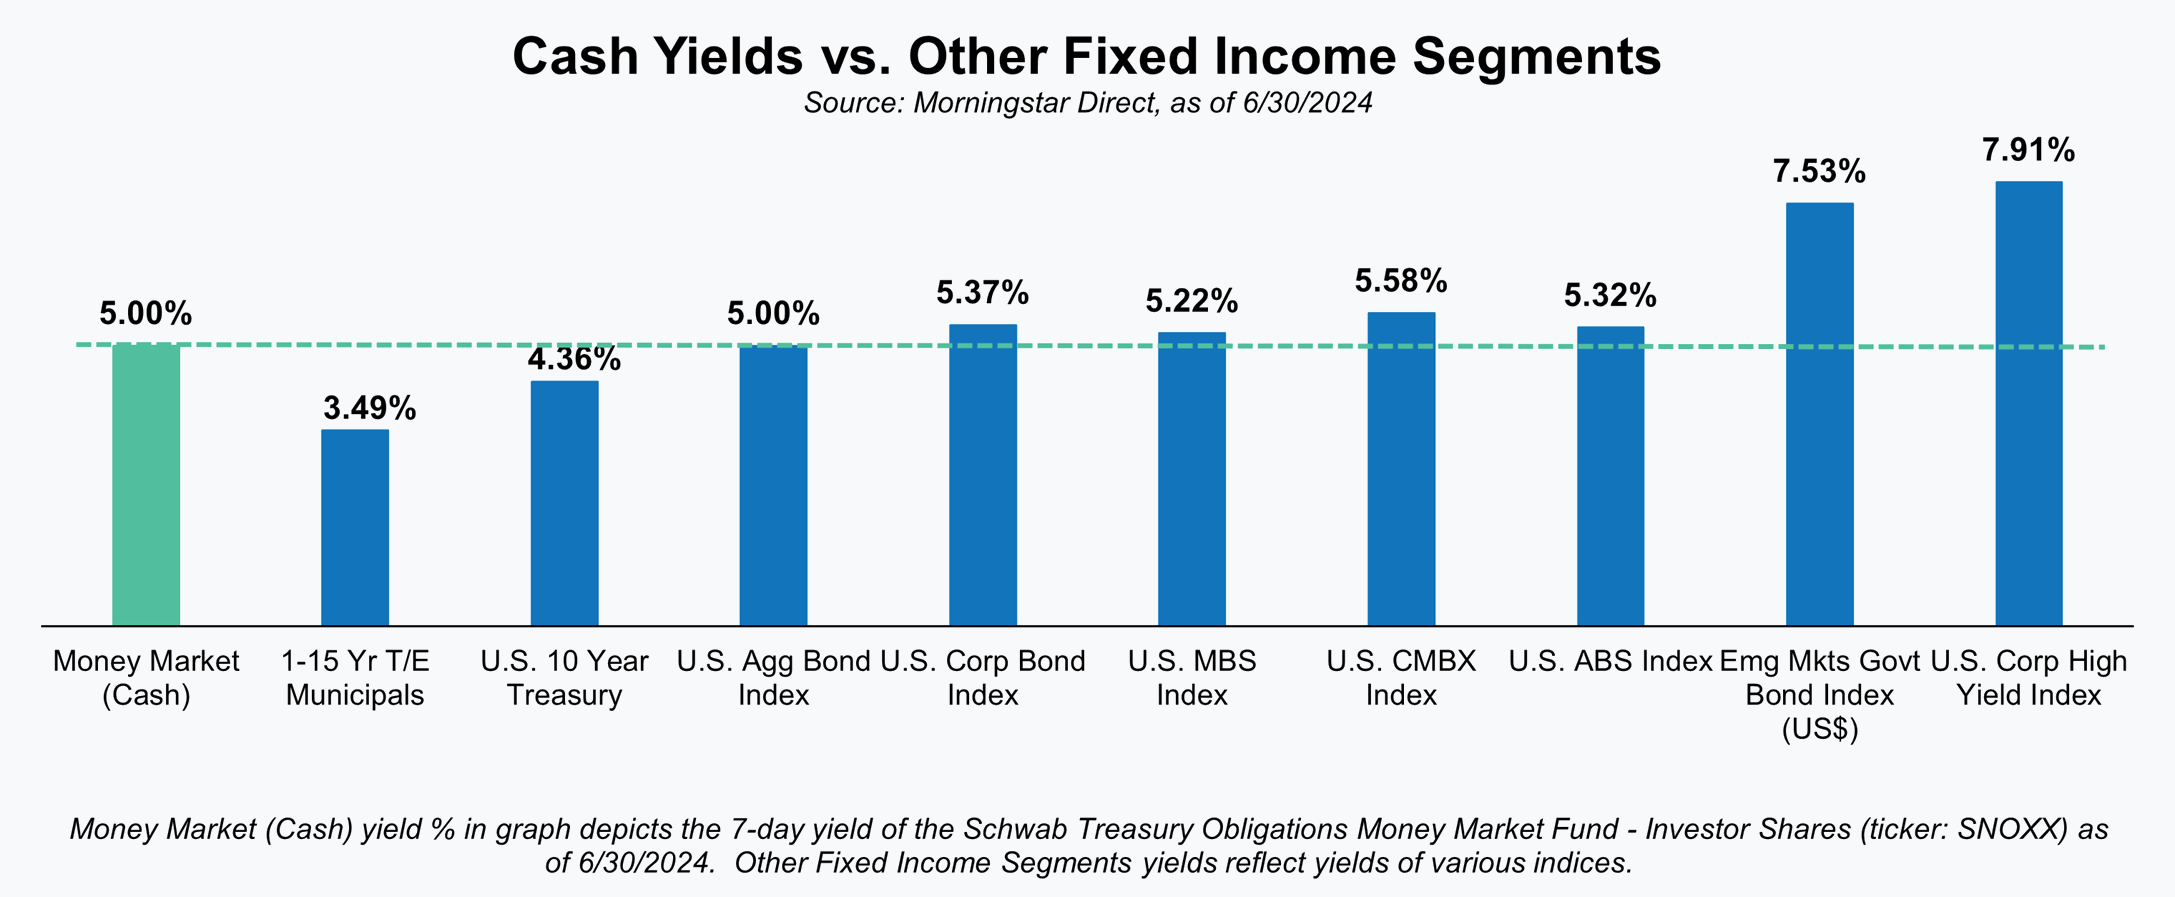
It has now been close to a year since the Federal Reserve’s last interest rate hike and while there has been a lot of noise around potential rate cuts, they have yet to take any official actions. As a result, money market funds still yield around 5% and the conversations we’re having around cash and traditional fixed income haven’t materially changed. Investors understandably continue to favor the consistency and safety of money markets over short to intermediate maturity bonds. Most short to intermediate bonds have similar to slightly higher yields compared to money market funds, but they come with varying levels of price volatility.
That may seem like a logical and straightforward choice or decision, but it’s also one that is likely to prove expensive in the long run. High current cash and money market yields are most likely temporary and investors thinking they will be able to swap from money markets to bonds at just the right time are unlikely to be successful. Timing the market may be a game most associated with stocks, but we’re seeing a lot of investors attempting to do it today with the fixed income portion of their portfolios. Unfortunately for those investors, we don’t expect attempts to time the bond market will be any more successful than trying to time the stock market.
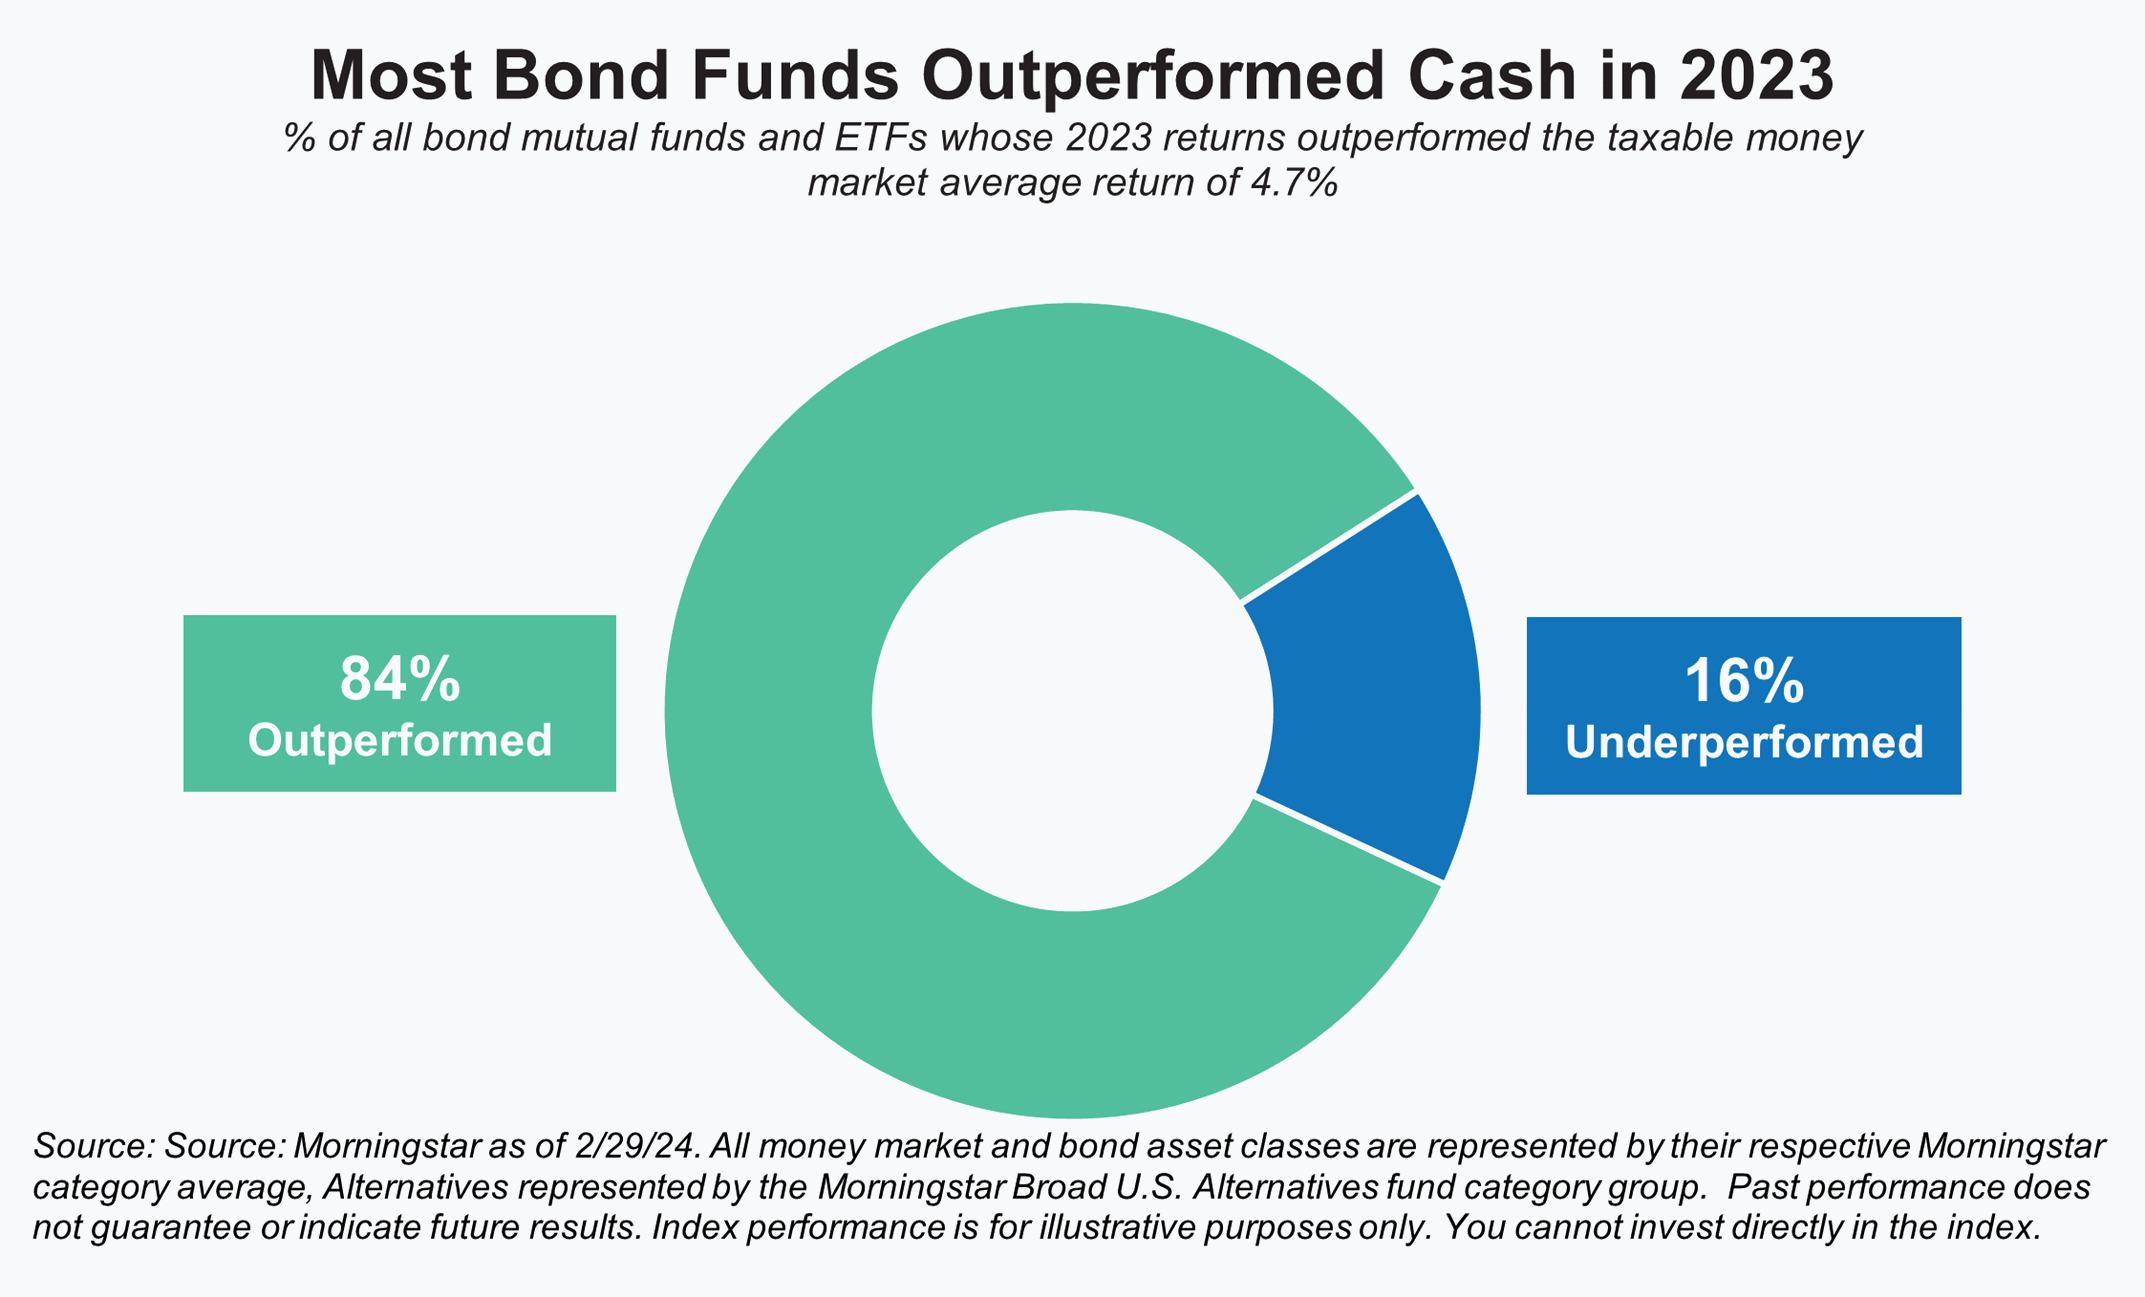
As part of our discussions around cash and fixed income, we’ve found this next illustration helpful. Most investors holding tightly to their cash allocations don’t realize that the vast majority of bond funds last year actually outperformed money market funds. While money markets did outperform for the majority of 2023, the strong rally in bonds in the final two months of the year made up for that (and then some).
We point to those results and the fast manner in which they happened because it could very well be a preview of how things will play out when the Fed finally starts to cut rates. We understand the temptation to try and time things, but in the long run, we believe that will prove a mistake – a potentially costly one.
Commodities + Real Assets + Alternatives
Due to the market volatility of the last few years, our alternatives allocations have played an increasingly important role in how we manage portfolios and in returns. As a result, we’ve often dedicated this section of Your CFO Report to detailing the types of strategies we use, and why. In doing so, we’ve typically emphasized that their role is most likely to be additive and noticeable when traditional markets fare poorly. Remember 2022?
That description, unfortunately or unfairly, gives the impression that such strategies are only expected to do well during difficult times. As we were happy to illustrate last quarter, however, that isn’t necessarily the case, and they can do quite well even during good periods for stocks and/or bonds.
After hopefully dispelling that misperception last quarter, we thought we should address another one that has come up frequently in our conversations with investors over the years. That is the notion that by investing in alternatives one is diluting long-term returns or accepting a lower return for less volatility. This comes up most often in our conversations about managed futures, a strategy we typically use as a complement or in place of equities. Not surprisingly, this comes up most often when stocks are doing well and people ask, “Can you remind me again why I own these other strategies?”.
To be fair, it’s a reasonable question. Managed futures strategies tend to be a bit of a mystery to most investors, fees are higher, and while they may make money in an up market, they aren’t likely to keep pace when stocks are really surging higher. With that said, if we look at a longer-term performance picture our interest in the strategy hopefully becomes clear.
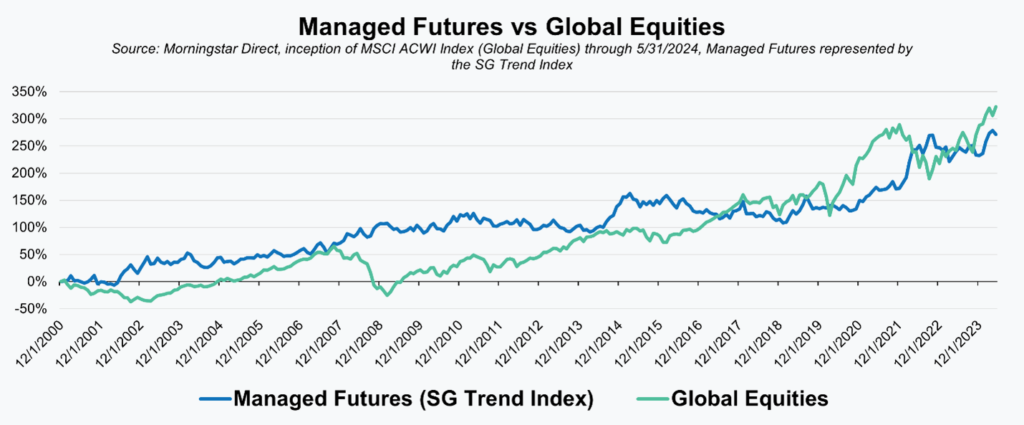
In our illustration, we are comparing an index of trend-following managed futures strategies, the SG Trend Index, with the global equity benchmark index, the MSCI ACWI (All Country World Index). Going back to the inception of the MSCI ACWI in 2001, the performance of the two varies significantly over time, as does the strategy that is “winning” at any particular point in time. This back-and-forth pattern matches our expectations and is precisely why we think they are good complements to each other.
By combining the two strategies, the path or pattern of returns will be different, of course, but that’s by design and doesn’t have to come at the expense of long-term returns. If anything, we’d argue that the combination creates a similar (or better) return with less volatility. In layman’s terms, the expectation or the destination remains the same, but the ride is less bumpy.
Unless stated otherwise, any estimates or projections (including performance and risk) given in this presentation are intended to be forward-looking statements. Such estimates are subject to actual known and unknown risks, uncertainties, and other factors that could cause actual results to differ materially from those projected. The securities described within this presentation do not represent all of the securities purchased, sold or recommended for client accounts. The reader should not assume that an investment in such securities was or will be profitable. Past performance does not indicate future results.
Want to get insights right to your inbox?
Subscribe to our newsletter to get inside access to timely news, trends and insights from Smith and Howard Wealth Management.
 July 9, 2024
 Back to Insights