Investors and financial markets had plenty to digest during the 4th quarter, but one would hardly know it by looking at returns for the full period. Despite two Federal Reserve rate cuts and a highly contentious election, equity markets were little moved. Unfortunately, at a global index level what movement did happen was negative. Bonds had a more meaningful move during the period and that move was also negative. The end result for most diversified U.S. investors was a modestly negative quarter to cap off what was still a strong calendar year.
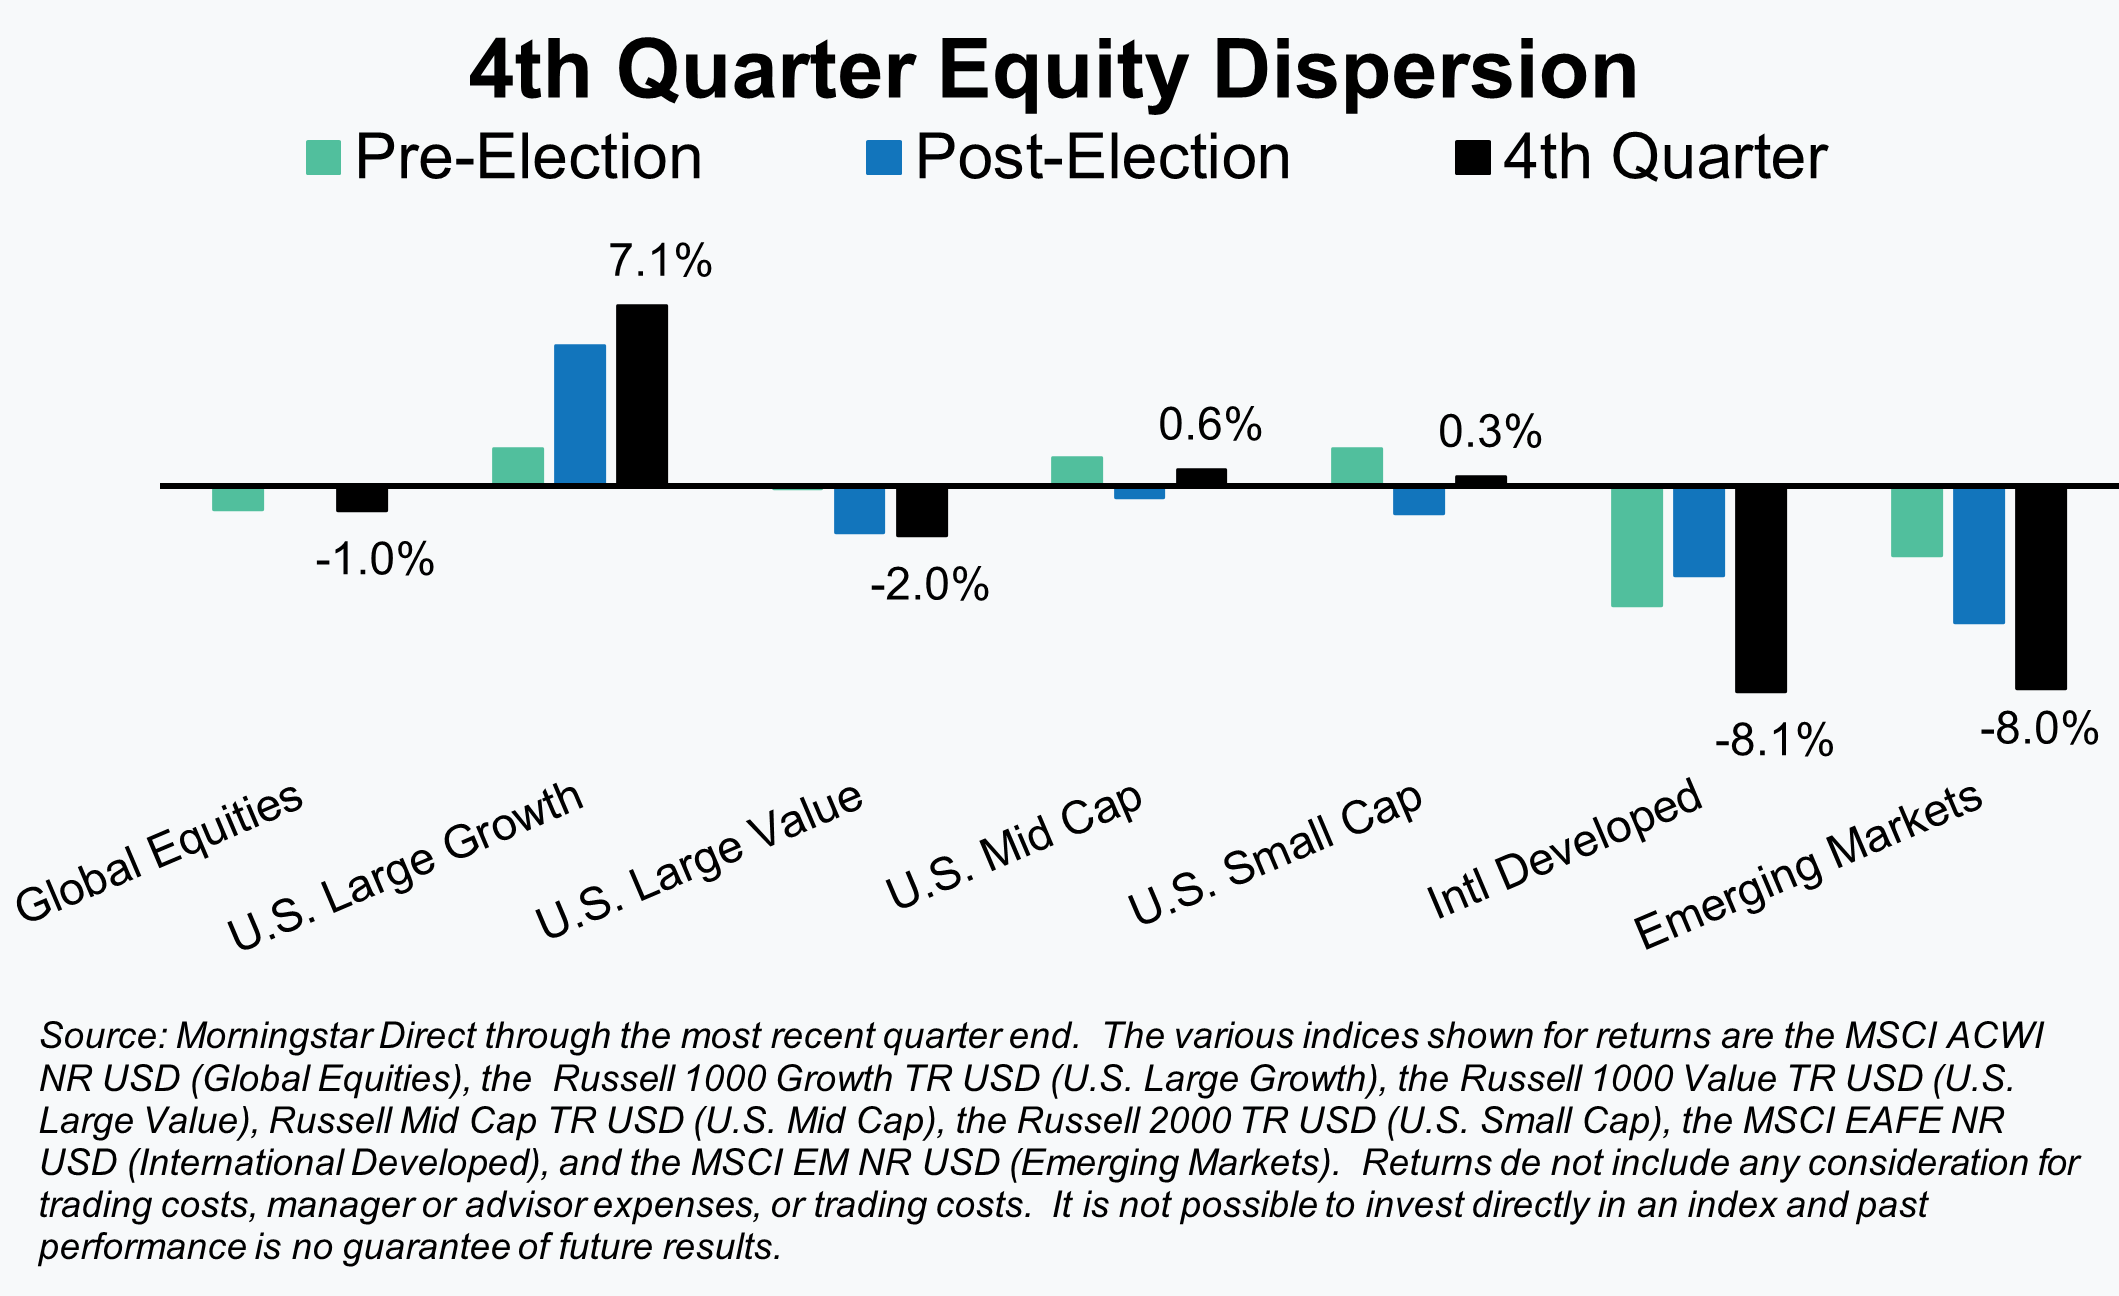
As is quite often the case, the headline numbers leave out important information – in this case, significant differentials in returns. This was particularly evident within equities. We’ll provide some thoughts on the “why” later in our equity market recap, but U.S. large cap growth stocks enjoyed a very strong quarter, while most other markets were flat or, in the case of international markets, fell materially.
The impact the election had in driving those differences is difficult to determine. U.S. large cap growth appeared to enjoy a significant bounce post-election. It was alone in that regard, though, when compared to other U.S. equity market segments. International markets, both developed and emerging, fell post-election, but that was also a continuation of their pre-election direction. When combined at a global level the result may not have been noteworthy and the catalysts unclear, but there were certainly some winners and losers for the period.
Equities
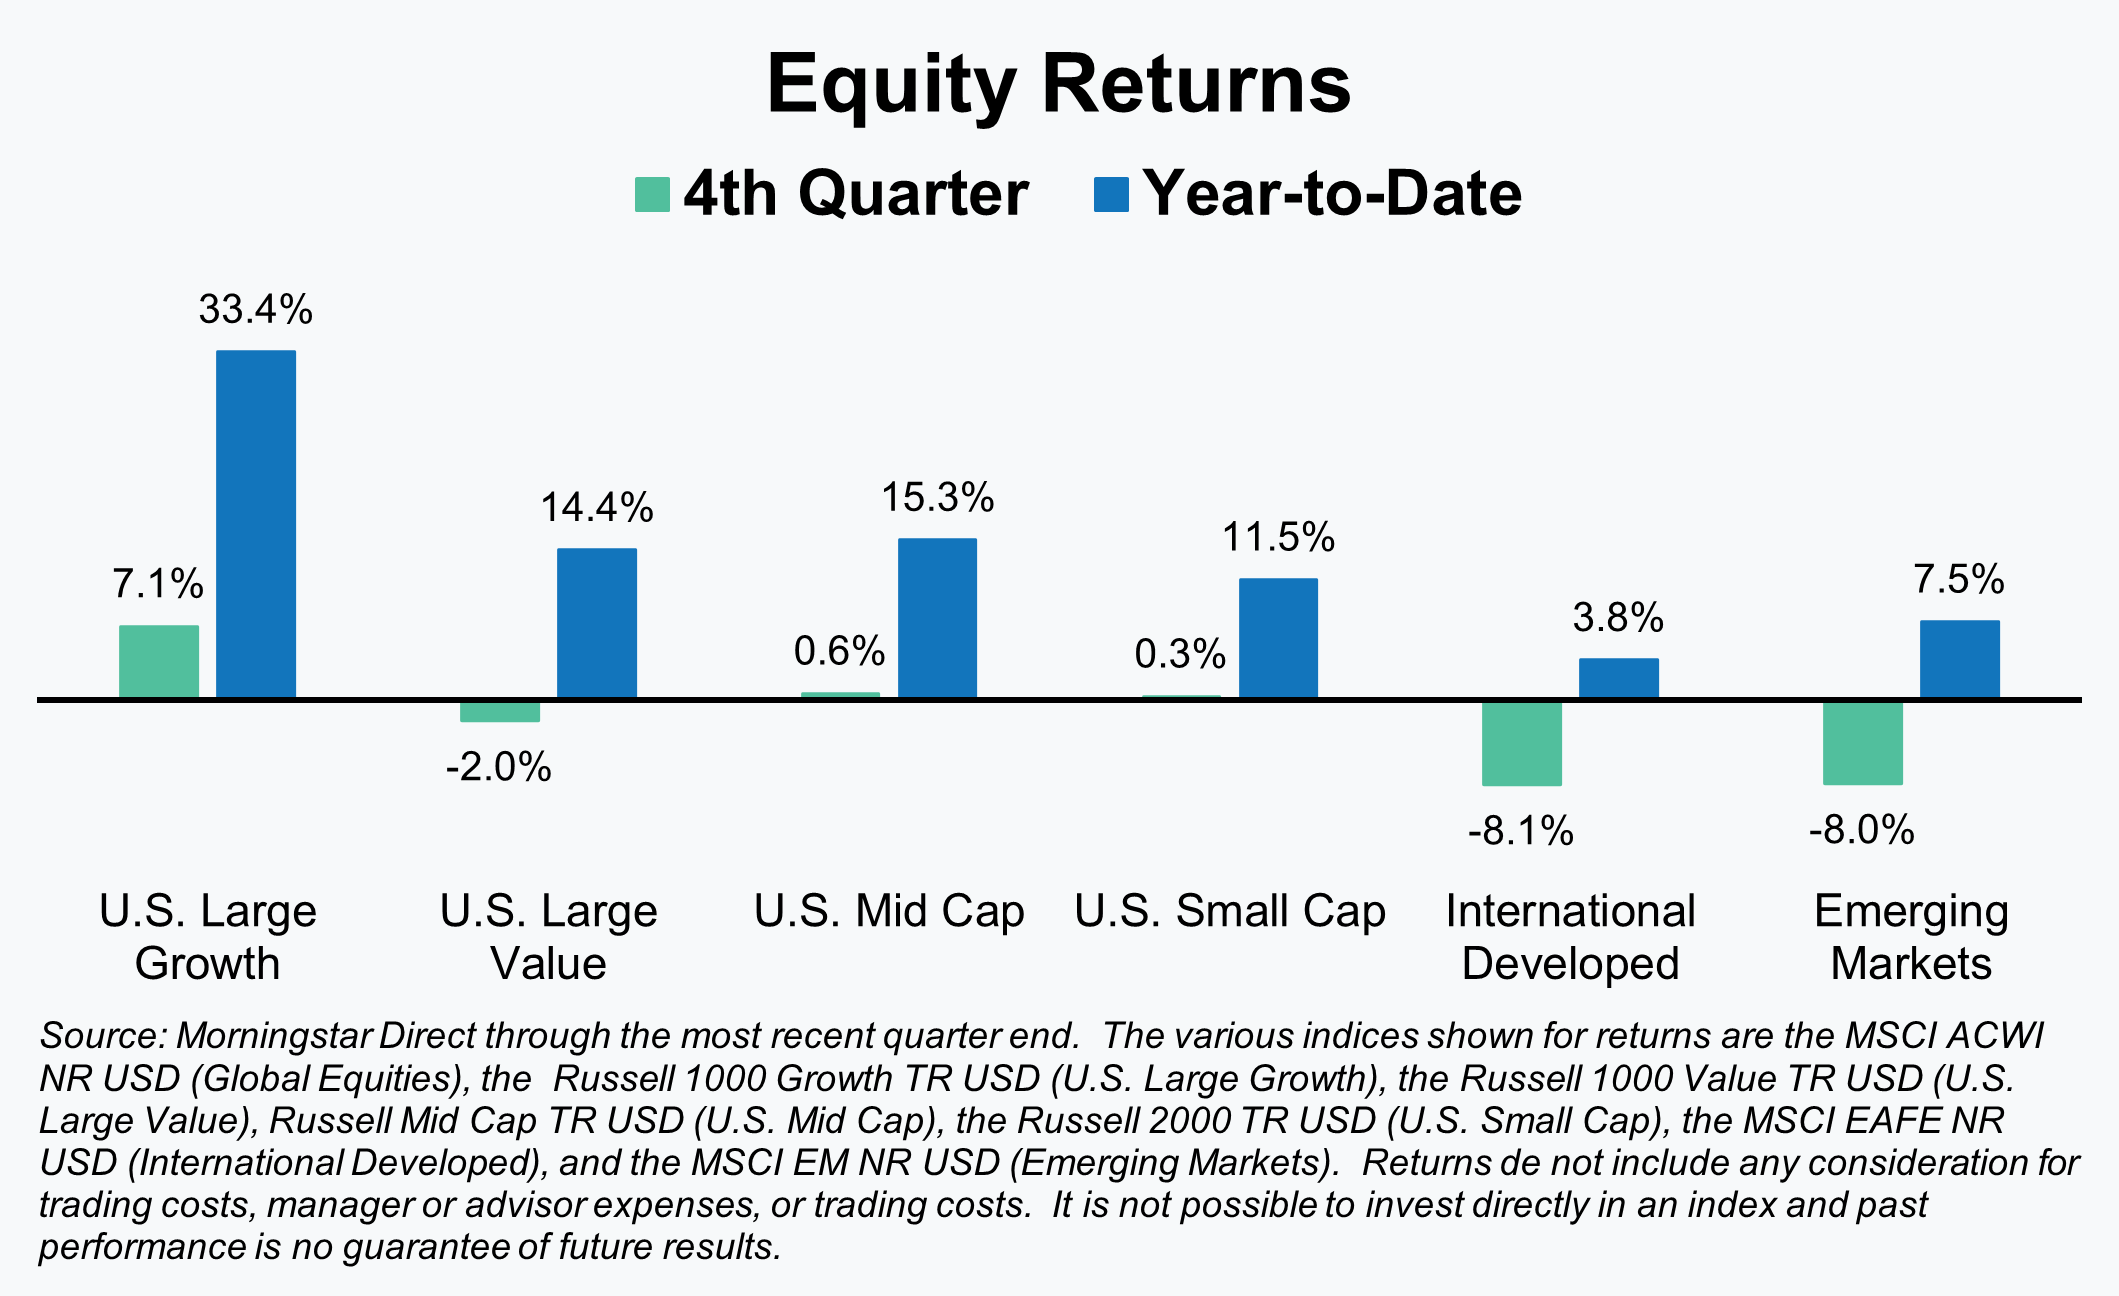
As noted in the Market Commentary, there was significant dispersion of returns when we look past the headline index number. Those relative return differences were spread across style, capitalization, and geography during the quarter. Full year returns, due in large part to the past three months, also show that same pattern. Fortunately for globally diversified investors, absolute returns for 2024 were positive across the board.
It may be impossible to determine how much the election drove recent returns, but it undoubtedly had an impact. U.S. large cap growth and international markets, both developed and emerging, appeared to be affected more than most, although in opposite directions. The surge higher in U.S. large cap growth stocks, however, may be another instance where the headline doesn’t tell the full story. U.S. large growth stocks did generally move higher, but if we look past the headline figures we’ll see that just two stocks, Tesla (+45%) and Broadcom (+35), account for 40% of the 7.1% quarterly return.
The drop in international stocks can be more clearly linked to the election results. Tariffs on foreign imports were a central theme of President-elect Trump’s campaign and that weighed heavily on international stocks both before and after the election. Many have speculated that the initial tariff levels being discussed are a starting point or a negotiating tactic. Regardless, the new administration has been clear in its plans, and that was viewed as a negative for international equities.
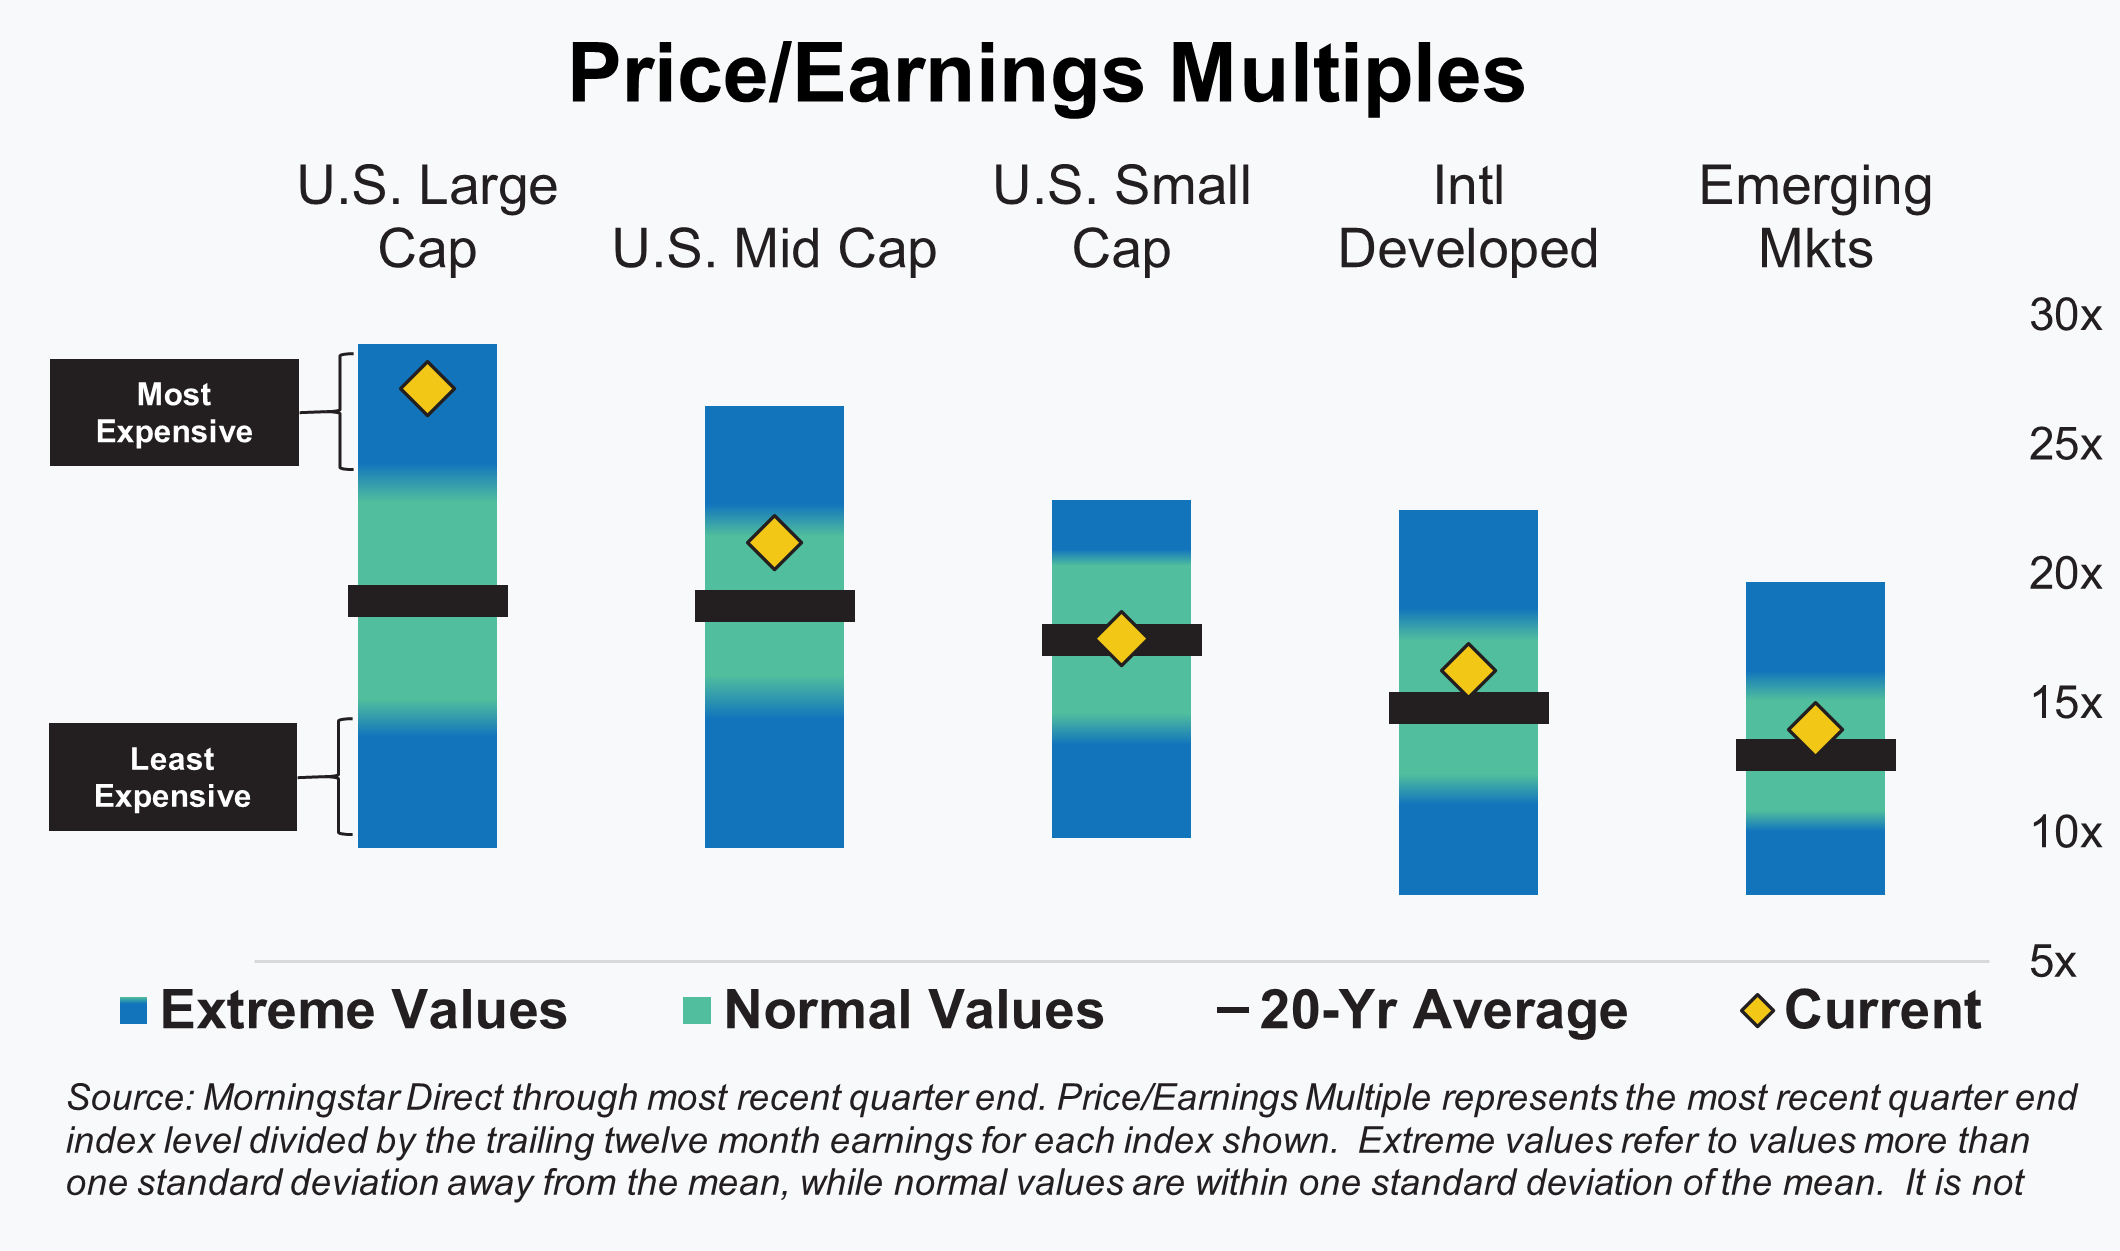
The big picture on equity market valuations didn’t change materially during the quarter. The overall argument, after two straight years of strong equity market returns, is that equities are again on the wrong side of average from a valuation perspective. The most notable is undoubtedly U.S. large cap stocks, driven in large part by large growth stocks. They are more expensive on a price-to-earnings multiple than at any time since the tech bubble. U.S. mid-cap, international developed, and emerging market valuations are more reasonable, but they are also above their 20-year average valuation levels. The only area not above its longer-term average is U.S. small cap and that segment sits right at average.
Despite valuations that sit mostly above long-term averages, we don’t think investors should overreact. As we’ve noted on multiple occasions, expensive assets can perform well and stay expensive for long periods. Additionally, with the exception of U.S. large cap stocks, most valuations sit at reasonable levels. They may not be cheap or indicative of above-average future returns, but they are close enough to average that we’d characterize them as fair. Opportunities exist, but investors will need to be realistic about future return levels and more discerning as to where they put their capital.
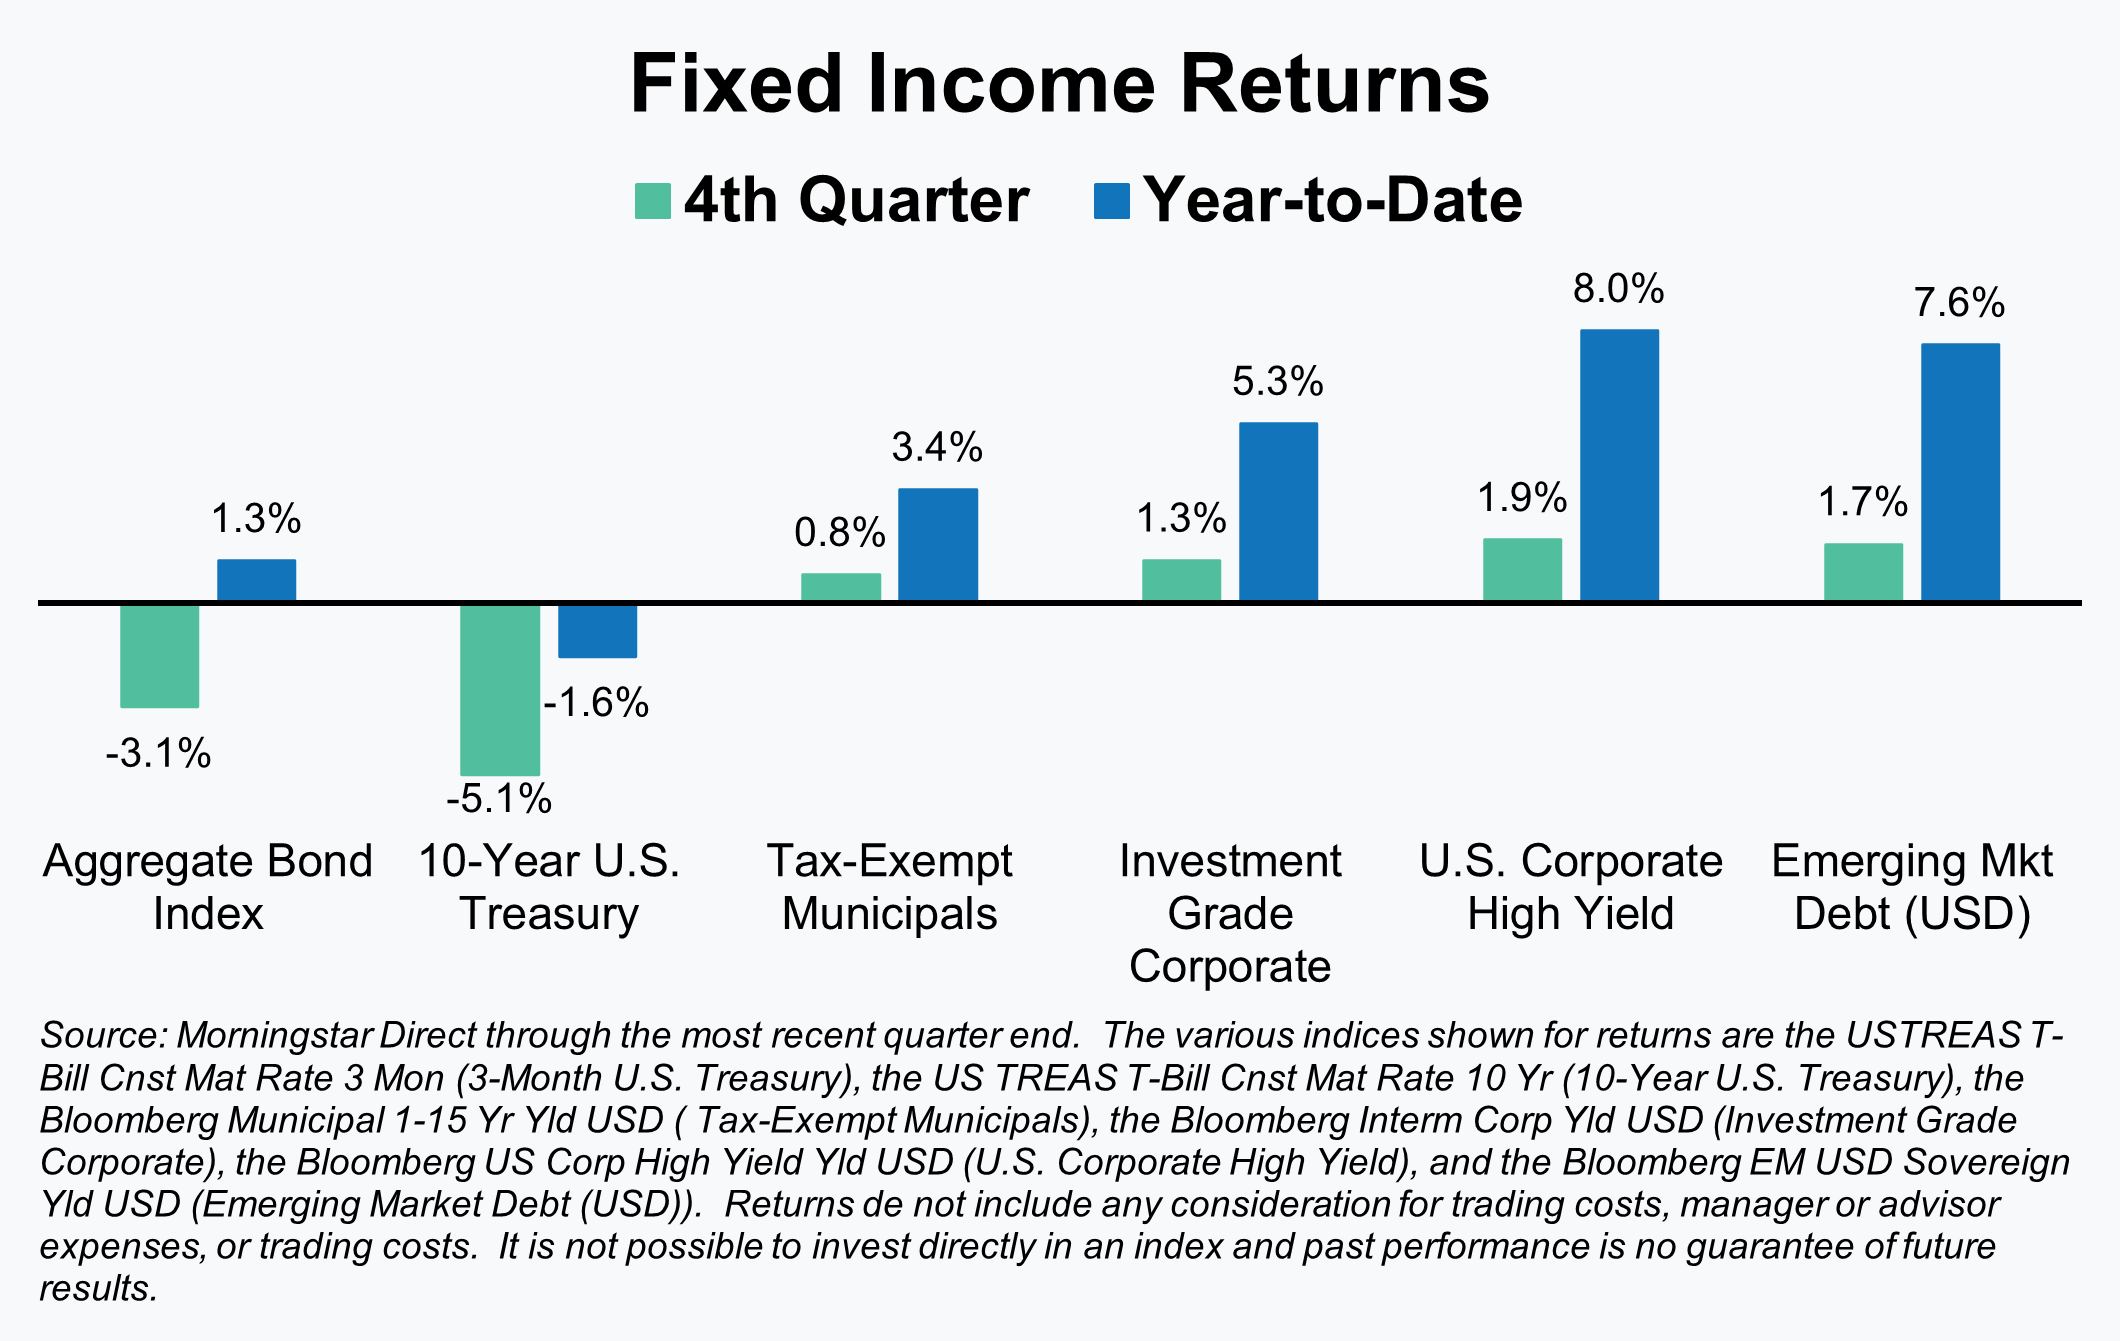
Fixed Income
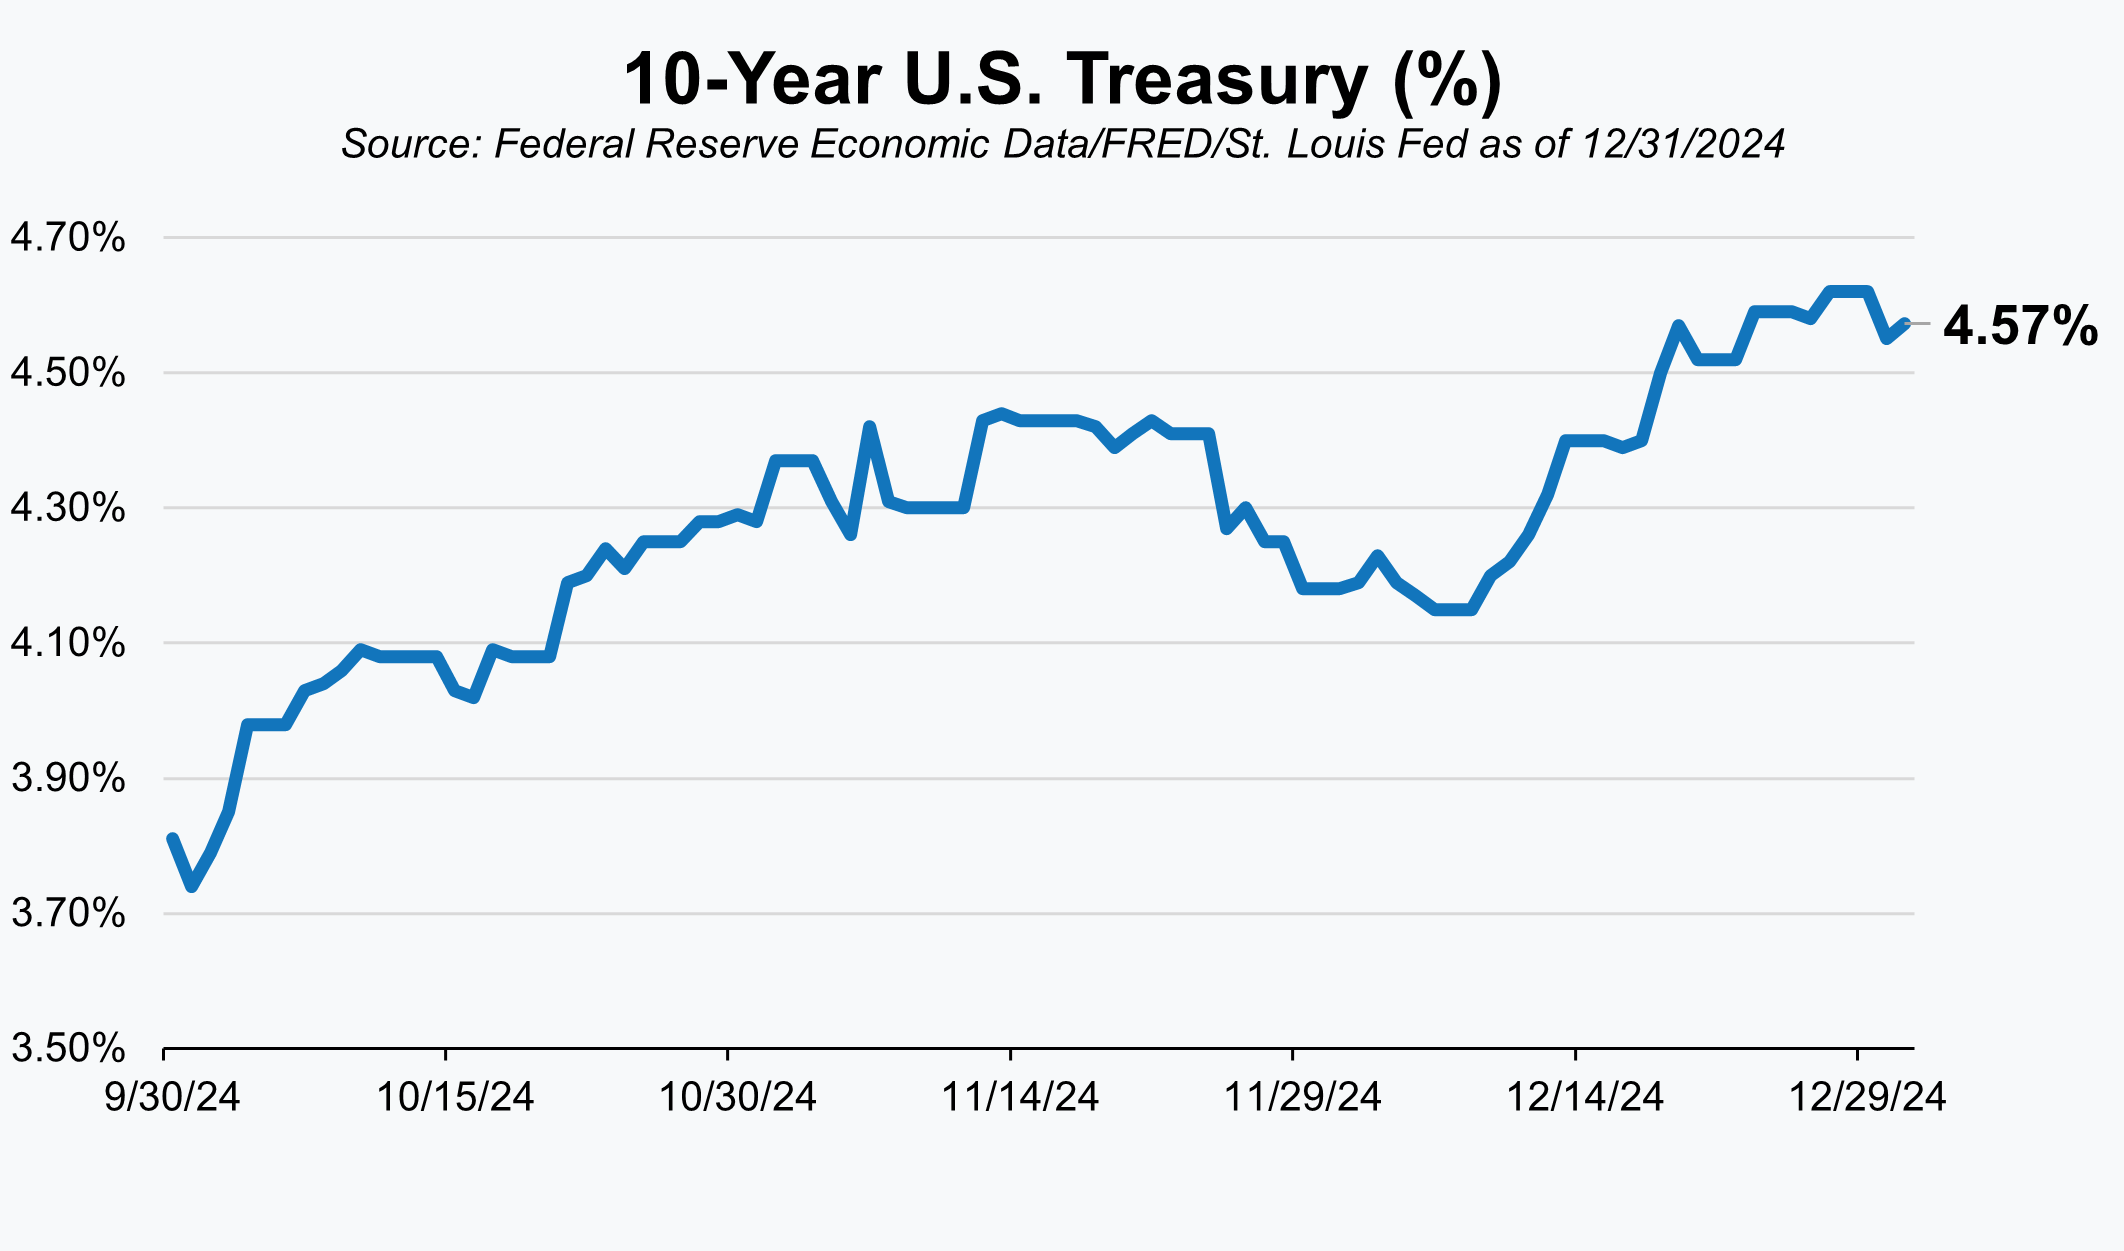
After an exceptionally strong 3rd quarter, bonds gave back a large chunk of that performance. The benchmark U.S. bond index fell 3.1% during the quarter which left it up just 1.3% for the full year. Bond prices and returns move in the opposite direction of bond yields and yields saw a steady climb higher throughout the past quarter. The 10-Year U.S. Treasury increased a total of 83 basis points (or 0.83%), climbing from a low of 3.74% to 4.57% by the end of the quarter.
The U.S. Treasury yield curve plays a pivotal role in helping determine prices for other bond segments, so the magnitude of the yield increase across Treasuries created a significant headwind. Fortunately, tightening credit spreads and higher starting point yields in other markets helped offset some of that spike in Treasury yields. Corporate, asset-backed, emerging market, and municipal debt all fared better than Treasuries and even enjoyed modest gains for the period.
Market pundits generally attributed the rise in yields to two dynamics – changing expectations for future rate cuts and the impact of possible new tariffs. While inflation is still falling, the Fed has noted that the rate of change has slowed. That has led the market to scale back expectations for rate cuts in 2025 and left rates higher across the curve. The incoming administration’s talk of higher tariffs on foreign goods also played a material role. While opinions certainly vary, most economists view tariffs as inflationary. Only time will tell if that proves true, but markets are anticipatory and will build those expectations into current pricing.
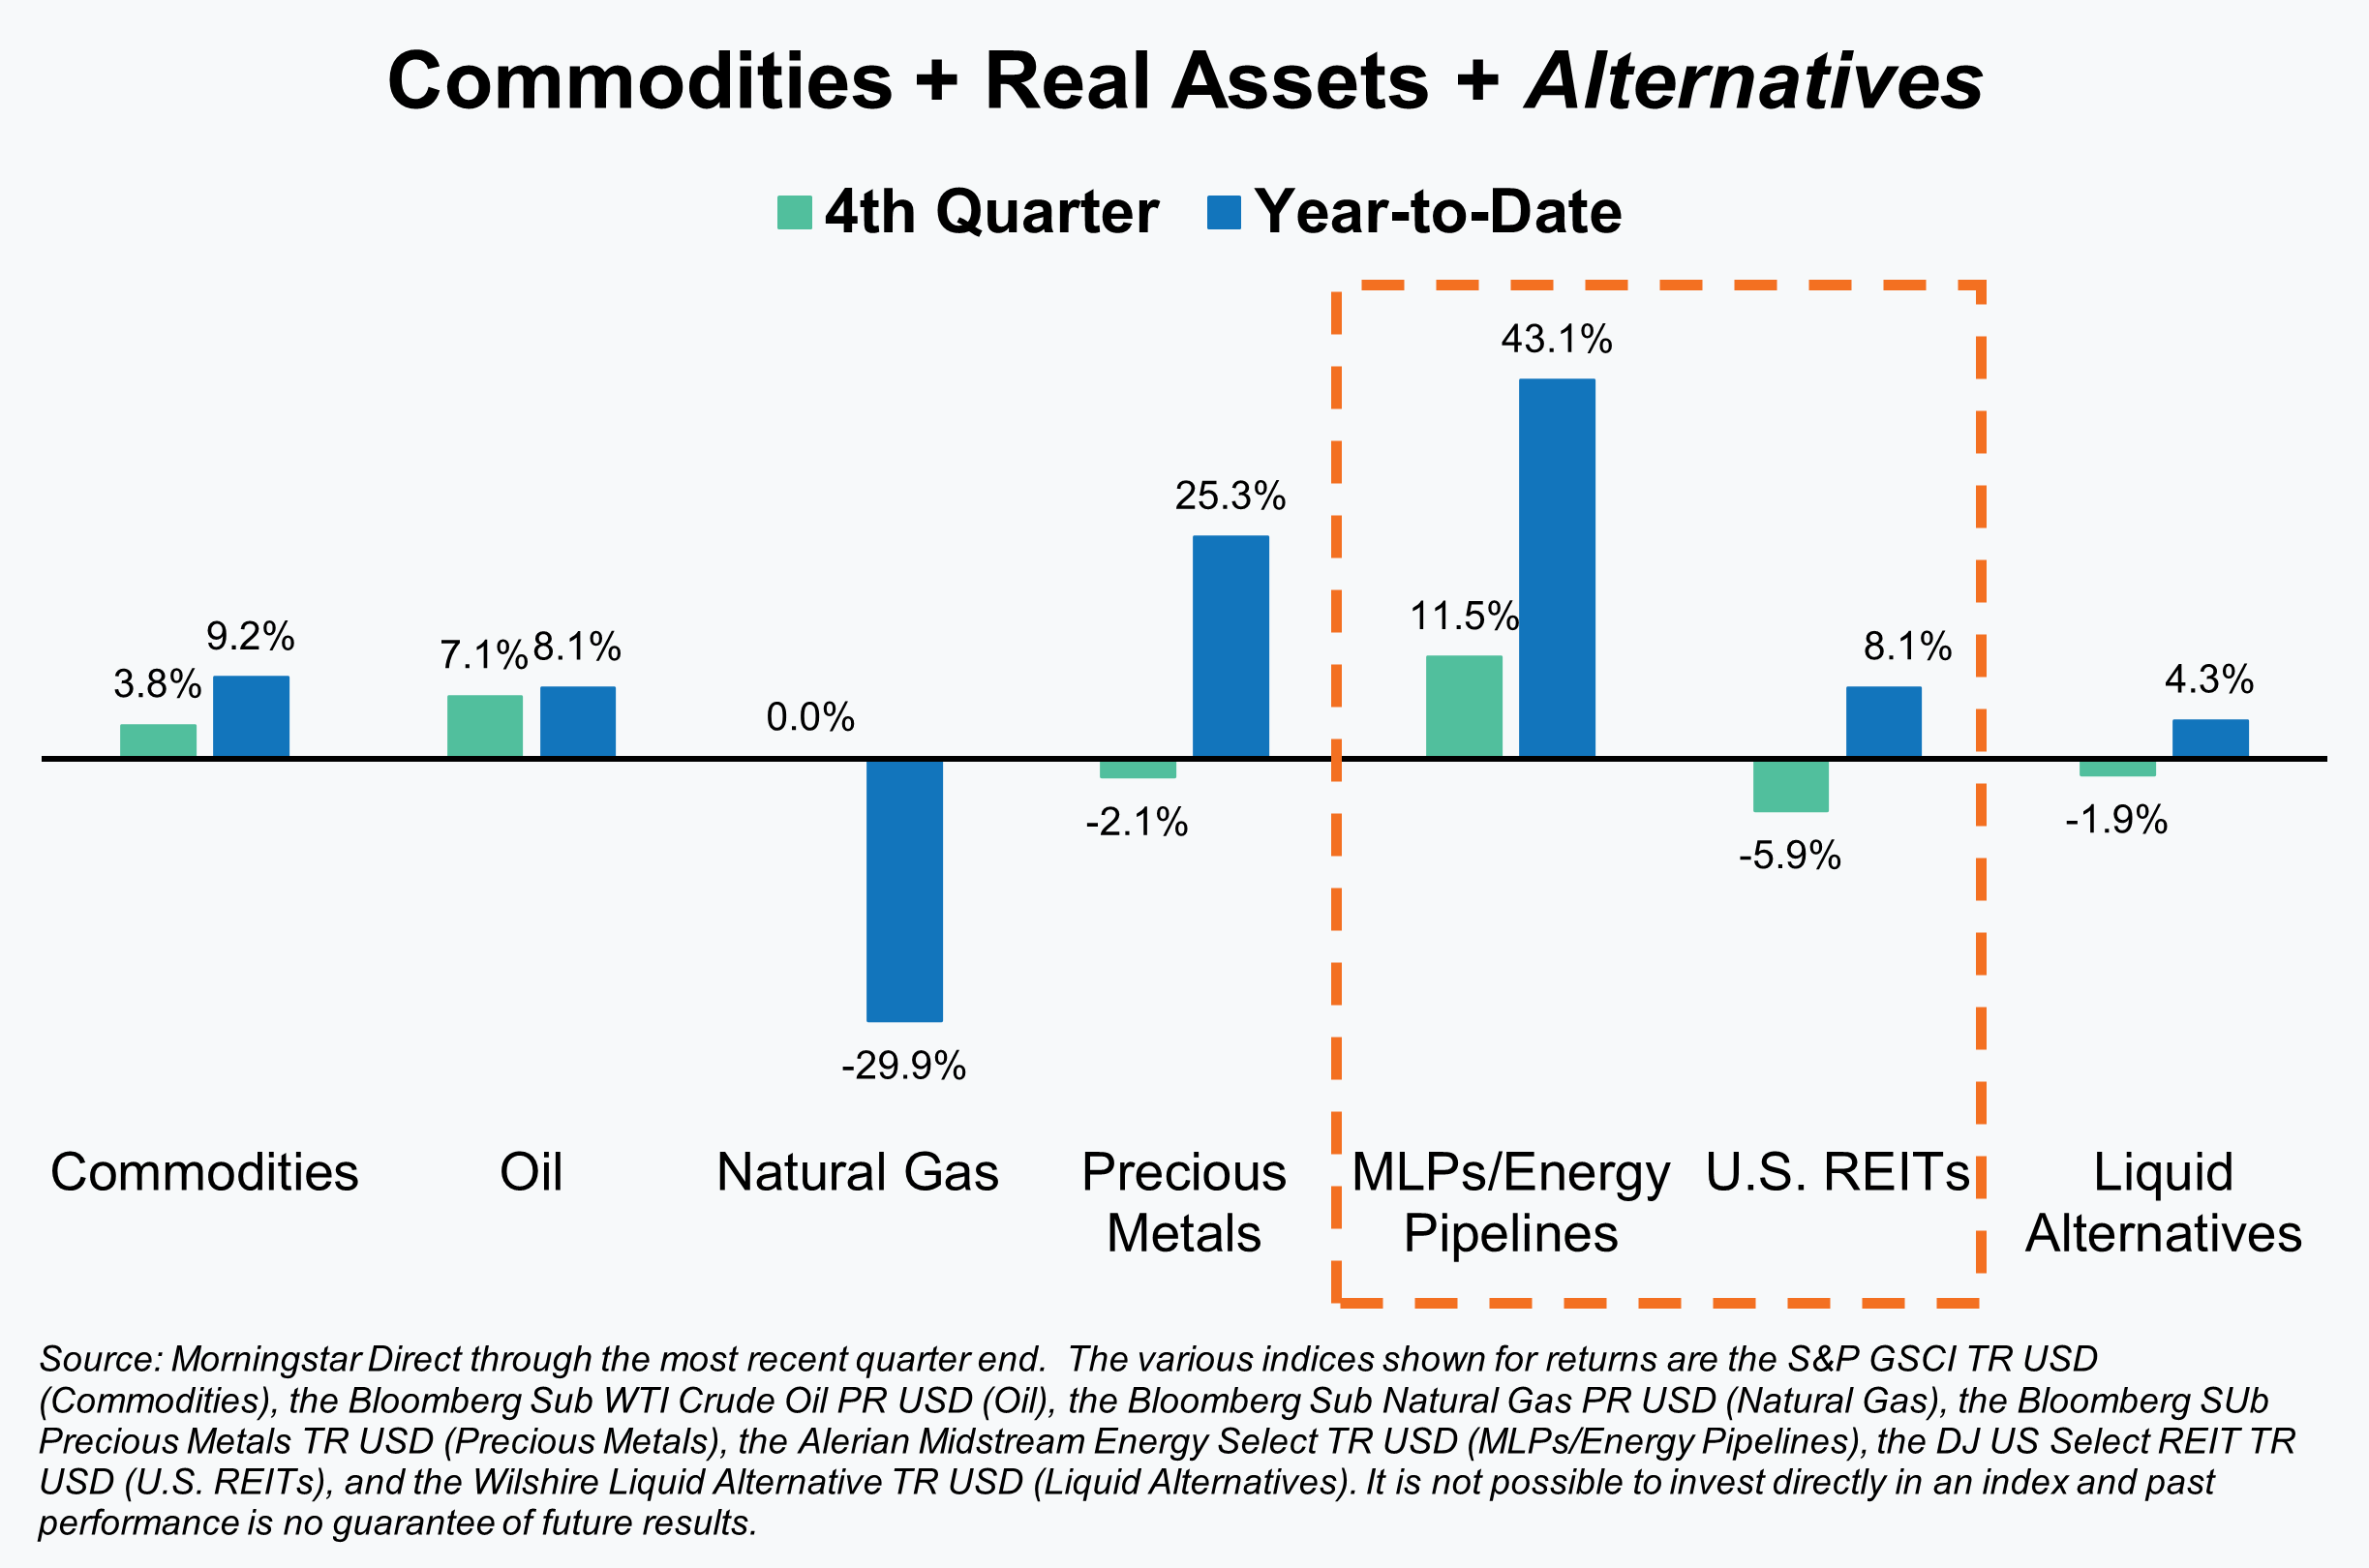
Commodities + Real Assets + Alternatives
Alternatives is not so much of an asset class as it is a collection of investment areas, types, and strategies that have unique characteristics and fall outside of traditional stocks and bonds. In keeping with that uniqueness, returns tend to be rather disparate or only loosely connected. The most notable example of that during the past quarter can be seen in the comparison of returns for MLPs/Energy Pipelines and U.S. REITs. Both tend to be yield-oriented investments, which means they often show a correlation with what is happening in the bond market. That appeared to be true in the case of U.S. REITs this quarter, but not for MLPs/Energy Pipelines.
MLPs/Energy Pipelines was one of the strongest segments of the market and finished up 11.5% for the quarter. They’ve also had an exceptionally strong year after somewhat surprisingly turning into a beneficiary of what is happening around Artificial Intelligence (AI). Check out our quarterly video segments for more discussion around AI and energy. U.S. REITs (Real Estate Investment Trusts), on the other hand, were down 5.9% for the quarter. REITs tend to be sensitive to interest rate or yield curve changes. As a result, REITs suffered from the same headwind that bond markets did during the past quarter.
Given our allocations to strategies like global macro and trend-following managed futures, we’ve also included “Liquid Alternatives” as part of our returns in the space. Liquid Alternatives is the return for the Wilshire Liquid Alternative index and is designed to measure the performance of an index of daily traded mutual funds (hence the liquid description, since they can be bought or sold daily) that Wilshire has categorized as alternative. Strategies in the index tend to be what most investors would consider hedge fund-like strategies – equity long/short, global macro, relative value, multi-strategy, and event-driven. We don’t employ all of these strategies but thought it would be a good overall reference for how such strategies have performed.
For clarification purposes please note that our listing of alternatives and returns for the period shown is far from an exhaustive list. We’ve chosen the areas or strategies shown primarily because they tend to be areas of interest for investors and/or areas that we own in client portfolios.
Unless stated otherwise, any estimates or projections (including performance and risk) given in this presentation are intended to be forward-looking statements. Such estimates are subject to actual known and unknown risks, uncertainties, and other factors that could cause actual results to differ materially from those projected. The securities described within this presentation do not represent all of the securities purchased, sold or recommended for client accounts. The reader should not assume that an investment in such securities was or will be profitable. Past performance does not indicate future results.
Want to get insights right to your inbox?
Subscribe to our newsletter to get inside access to timely news, trends and insights from Smith and Howard Wealth Management.
 January 10, 2025
 Back to Insights