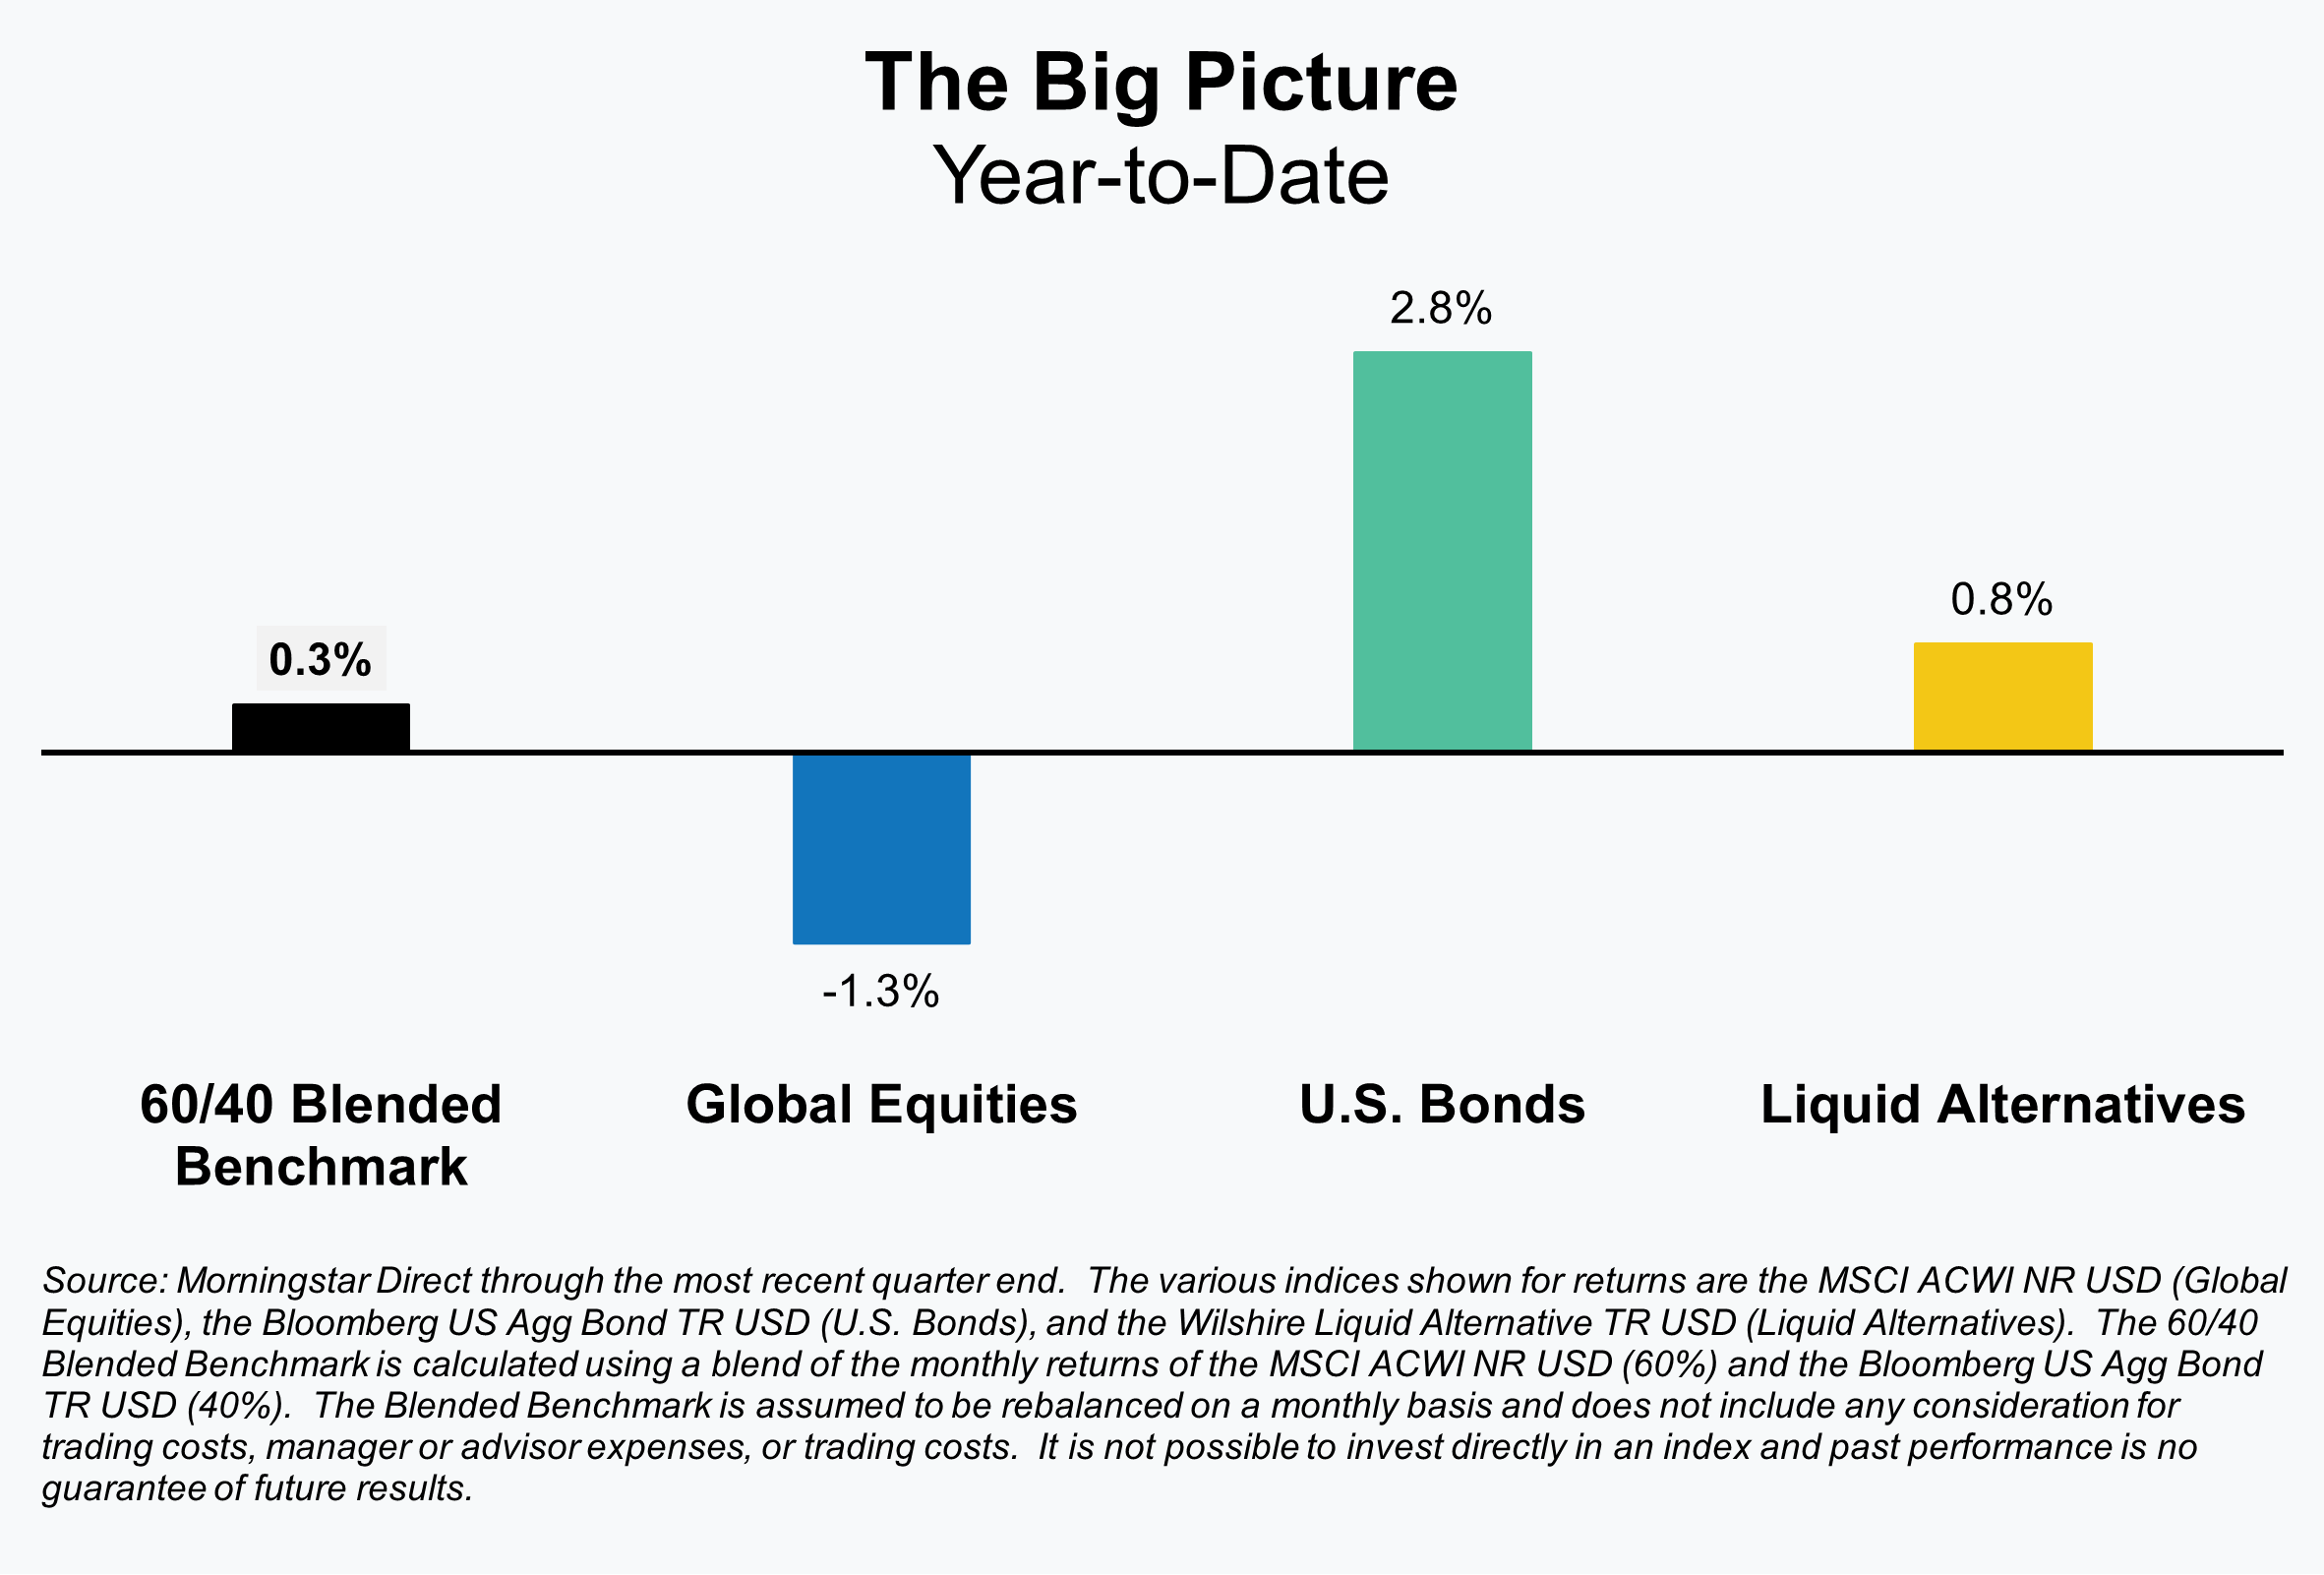
The first quarter of 2025 had more than its fair share of market moving headlines and volatility, yet for investors with a well-diversified portfolio, performance for the quarter was likely not eye-catching. Total portfolio results may not have been remarkable, but there were some very notable market moves, including U.S. equities which experienced an intra-quarter selloff of more than 10%! In fact, given the media and investors’ focus on domestic equity markets, many investors are likely to be surprised when they realize that despite the headlines and selloff, their portfolios were little changed and, in some cases, positive.
Deciphering what’s driven financial markets during a particular day, month, or quarter always involves some level of guesswork, but the narrative for this past quarter seems uncharacteristically clear. That narrative, at least for equities, revolves around the new administration and can be neatly divided between a post-election rally and a dissipation of that rally.
Post-Election Rally: Market expectations on economic growth rapidly repriced higher due to anticipation of deregulation, extension of tax cuts, and a generally pro-business administration.
Dissipation of the Rally: Markets adjusted to the realities of shifting policy priorities as tariffs and immigration appeared to be more of an early focus of the new administration. It didn’t help that economic data, while still generally solid, showed some softening.
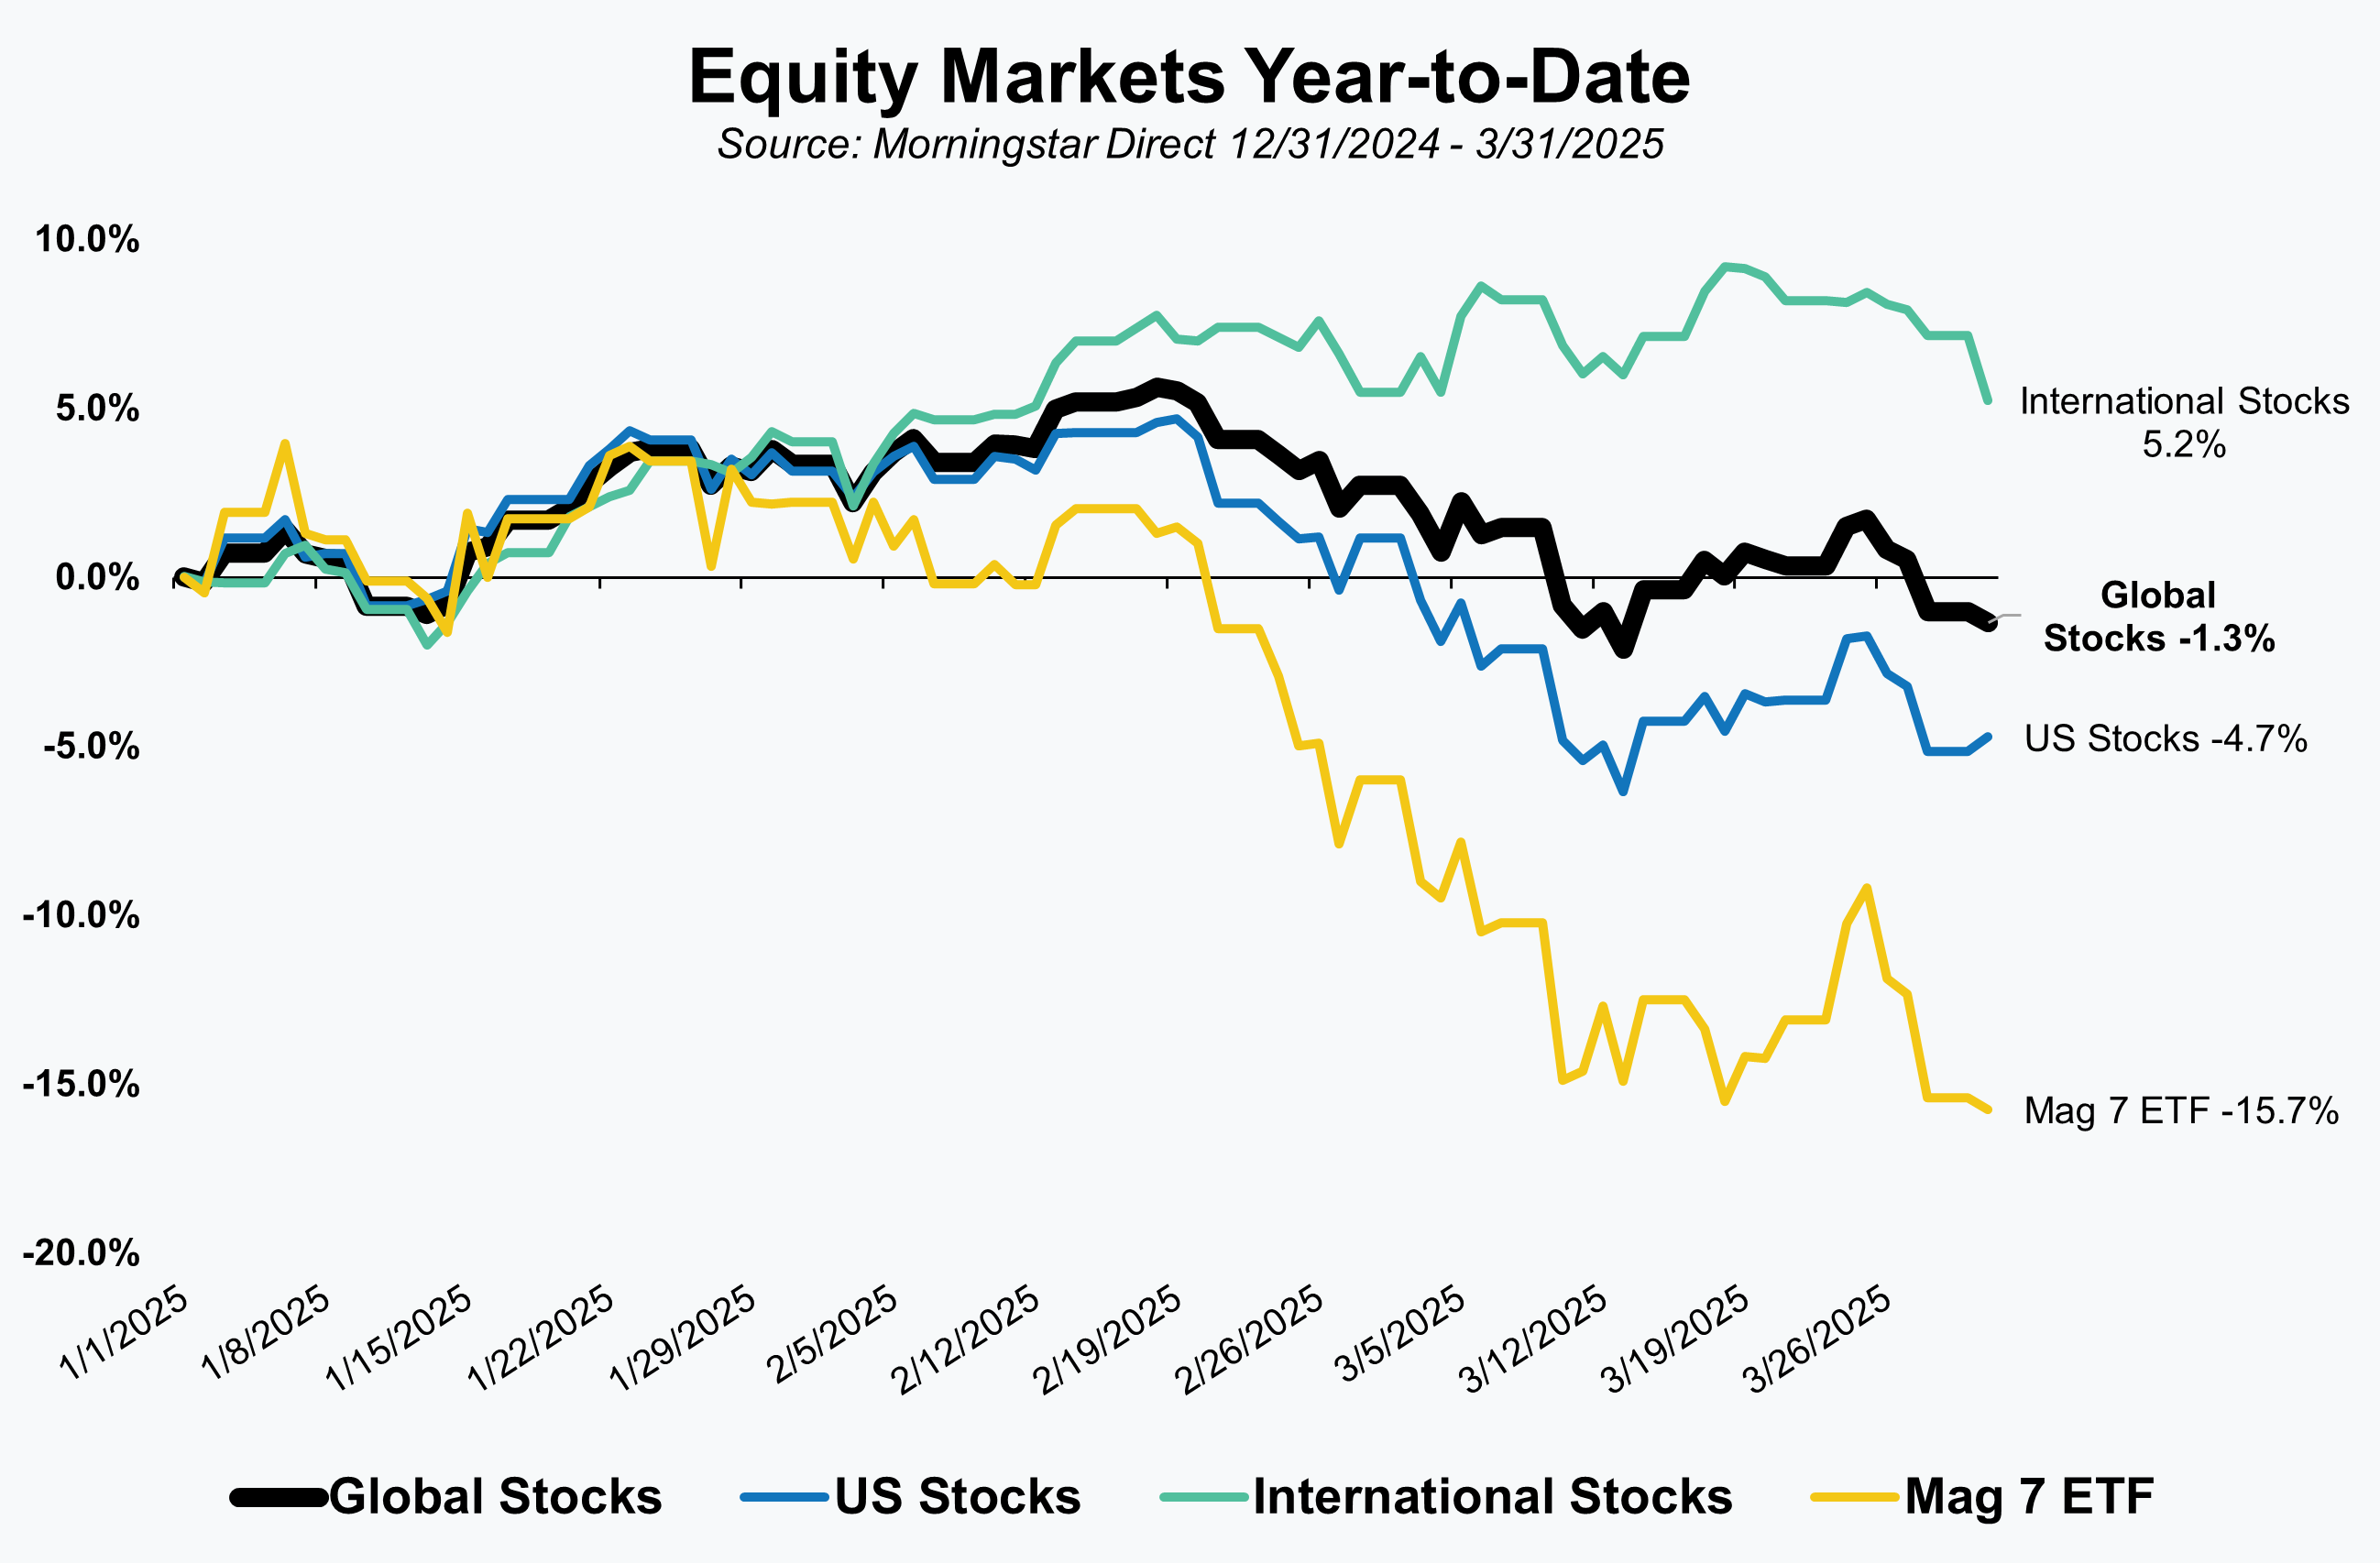
As the graph shows, equity markets were generally positive until about the middle of February. After reaching a new all-time high on February 18th U.S. stocks abruptly turned lower and gave up their year-to-date gains. By March 13th, U.S. stocks had seen a year-to-date gain of 5.3% evaporate and turn into a loss of 6.3%. Losses were felt most acutely among some of the large tech companies, especially the “Mag 7” (Microsoft, NVIDIA, Amazon, Alphabet (Google), Meta and Tesla). The Exchange Traded Fund (ETF) that tracks the Magnificent 7 stocks fell nearly 19% from its early year high. Fortunately for equity investors, international stocks fared far better throughout the quarter.
Equities
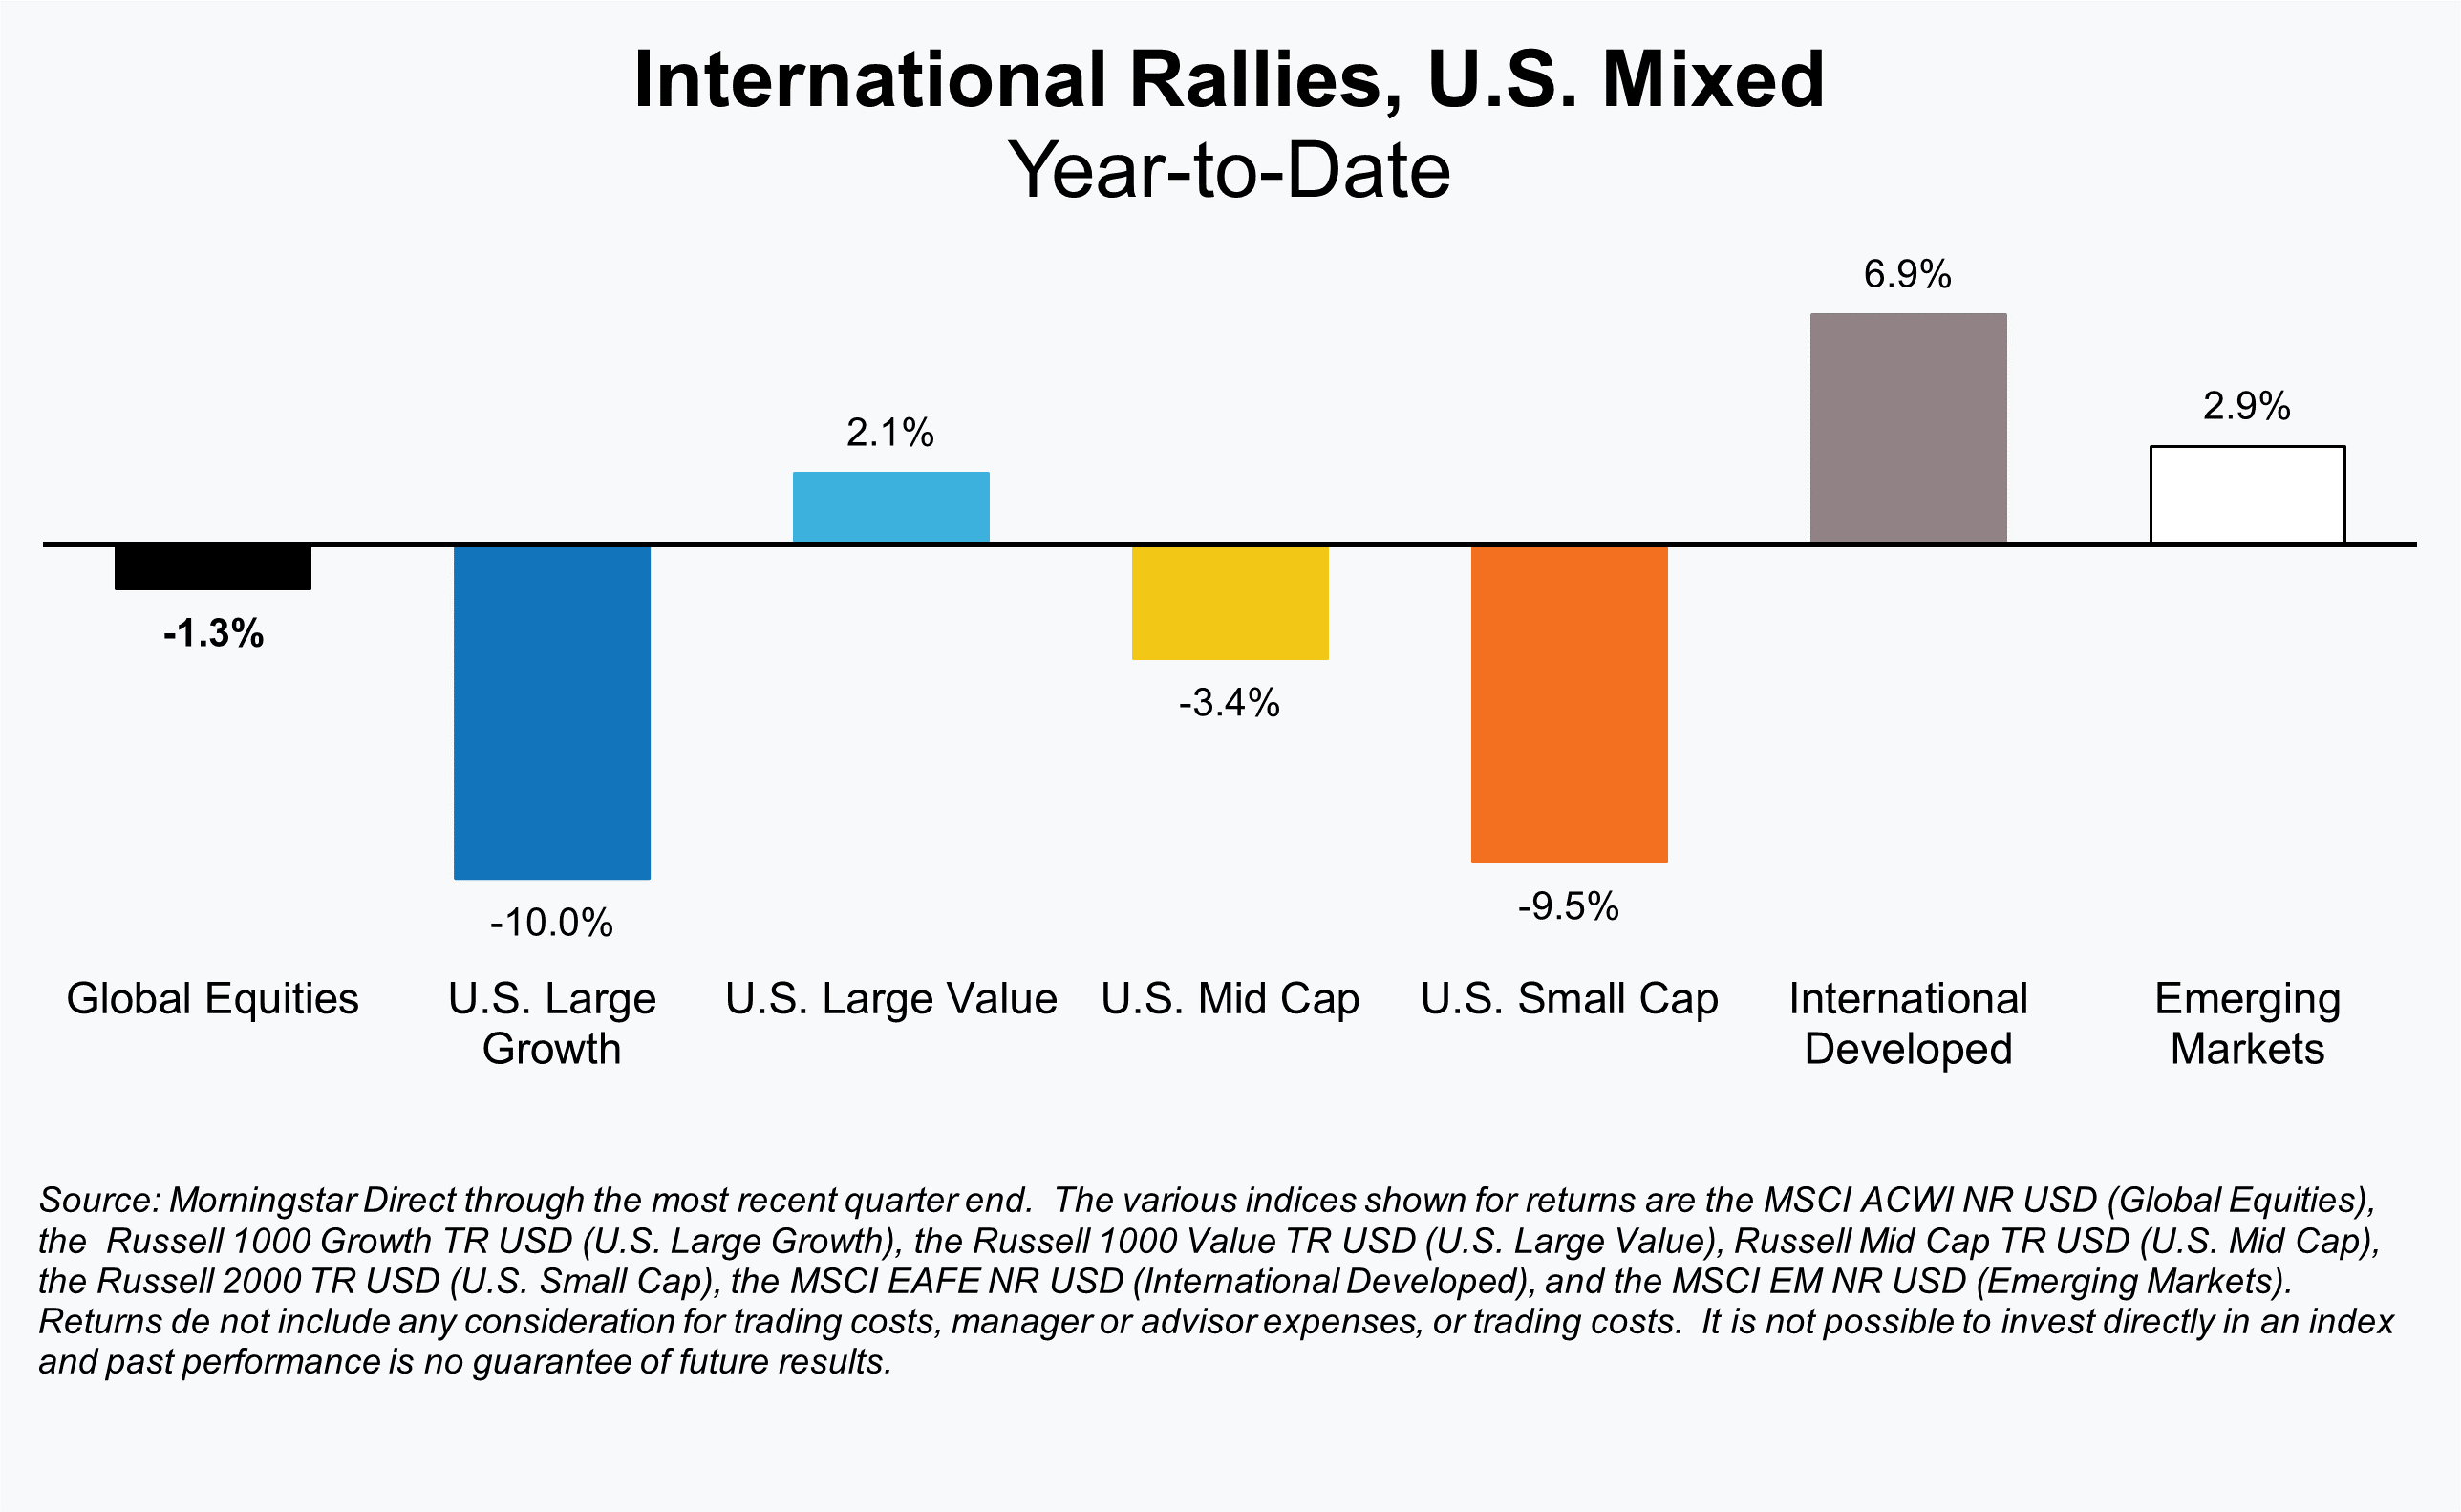
When investors look past the headline global index returns they’ll note that there was a significant differential in returns driven by geography. International markets, both developed and emerging, far outpaced U.S. equity markets.
This was unfortunate for many U.S. investors for a couple of reasons. First, while we’ve retained a more global approach that maintains a healthy allocation to international markets, we’ve noted that many advisors and investors have increasingly concentrated their equities in U.S. markets. We know that some have gone even further and completely abandoned international markets over the past few years. Second, many of those same investors were further concentrated in the “Mag 7” stocks that suffered some of the largest losses.
Despite a strong quarter of outperformance for international stocks, it is too early for investors to start wondering if there has been any type of a more permanent shift. Rather than try and chase the hot-dot or predict such trends, we let valuations point us in the right direction. International market valuations, both developed and emerging still appear fair, but they aren’t necessarily cheap or at levels where we might be more inclined to think positively about a longer timeframe change in sentiment or trends.
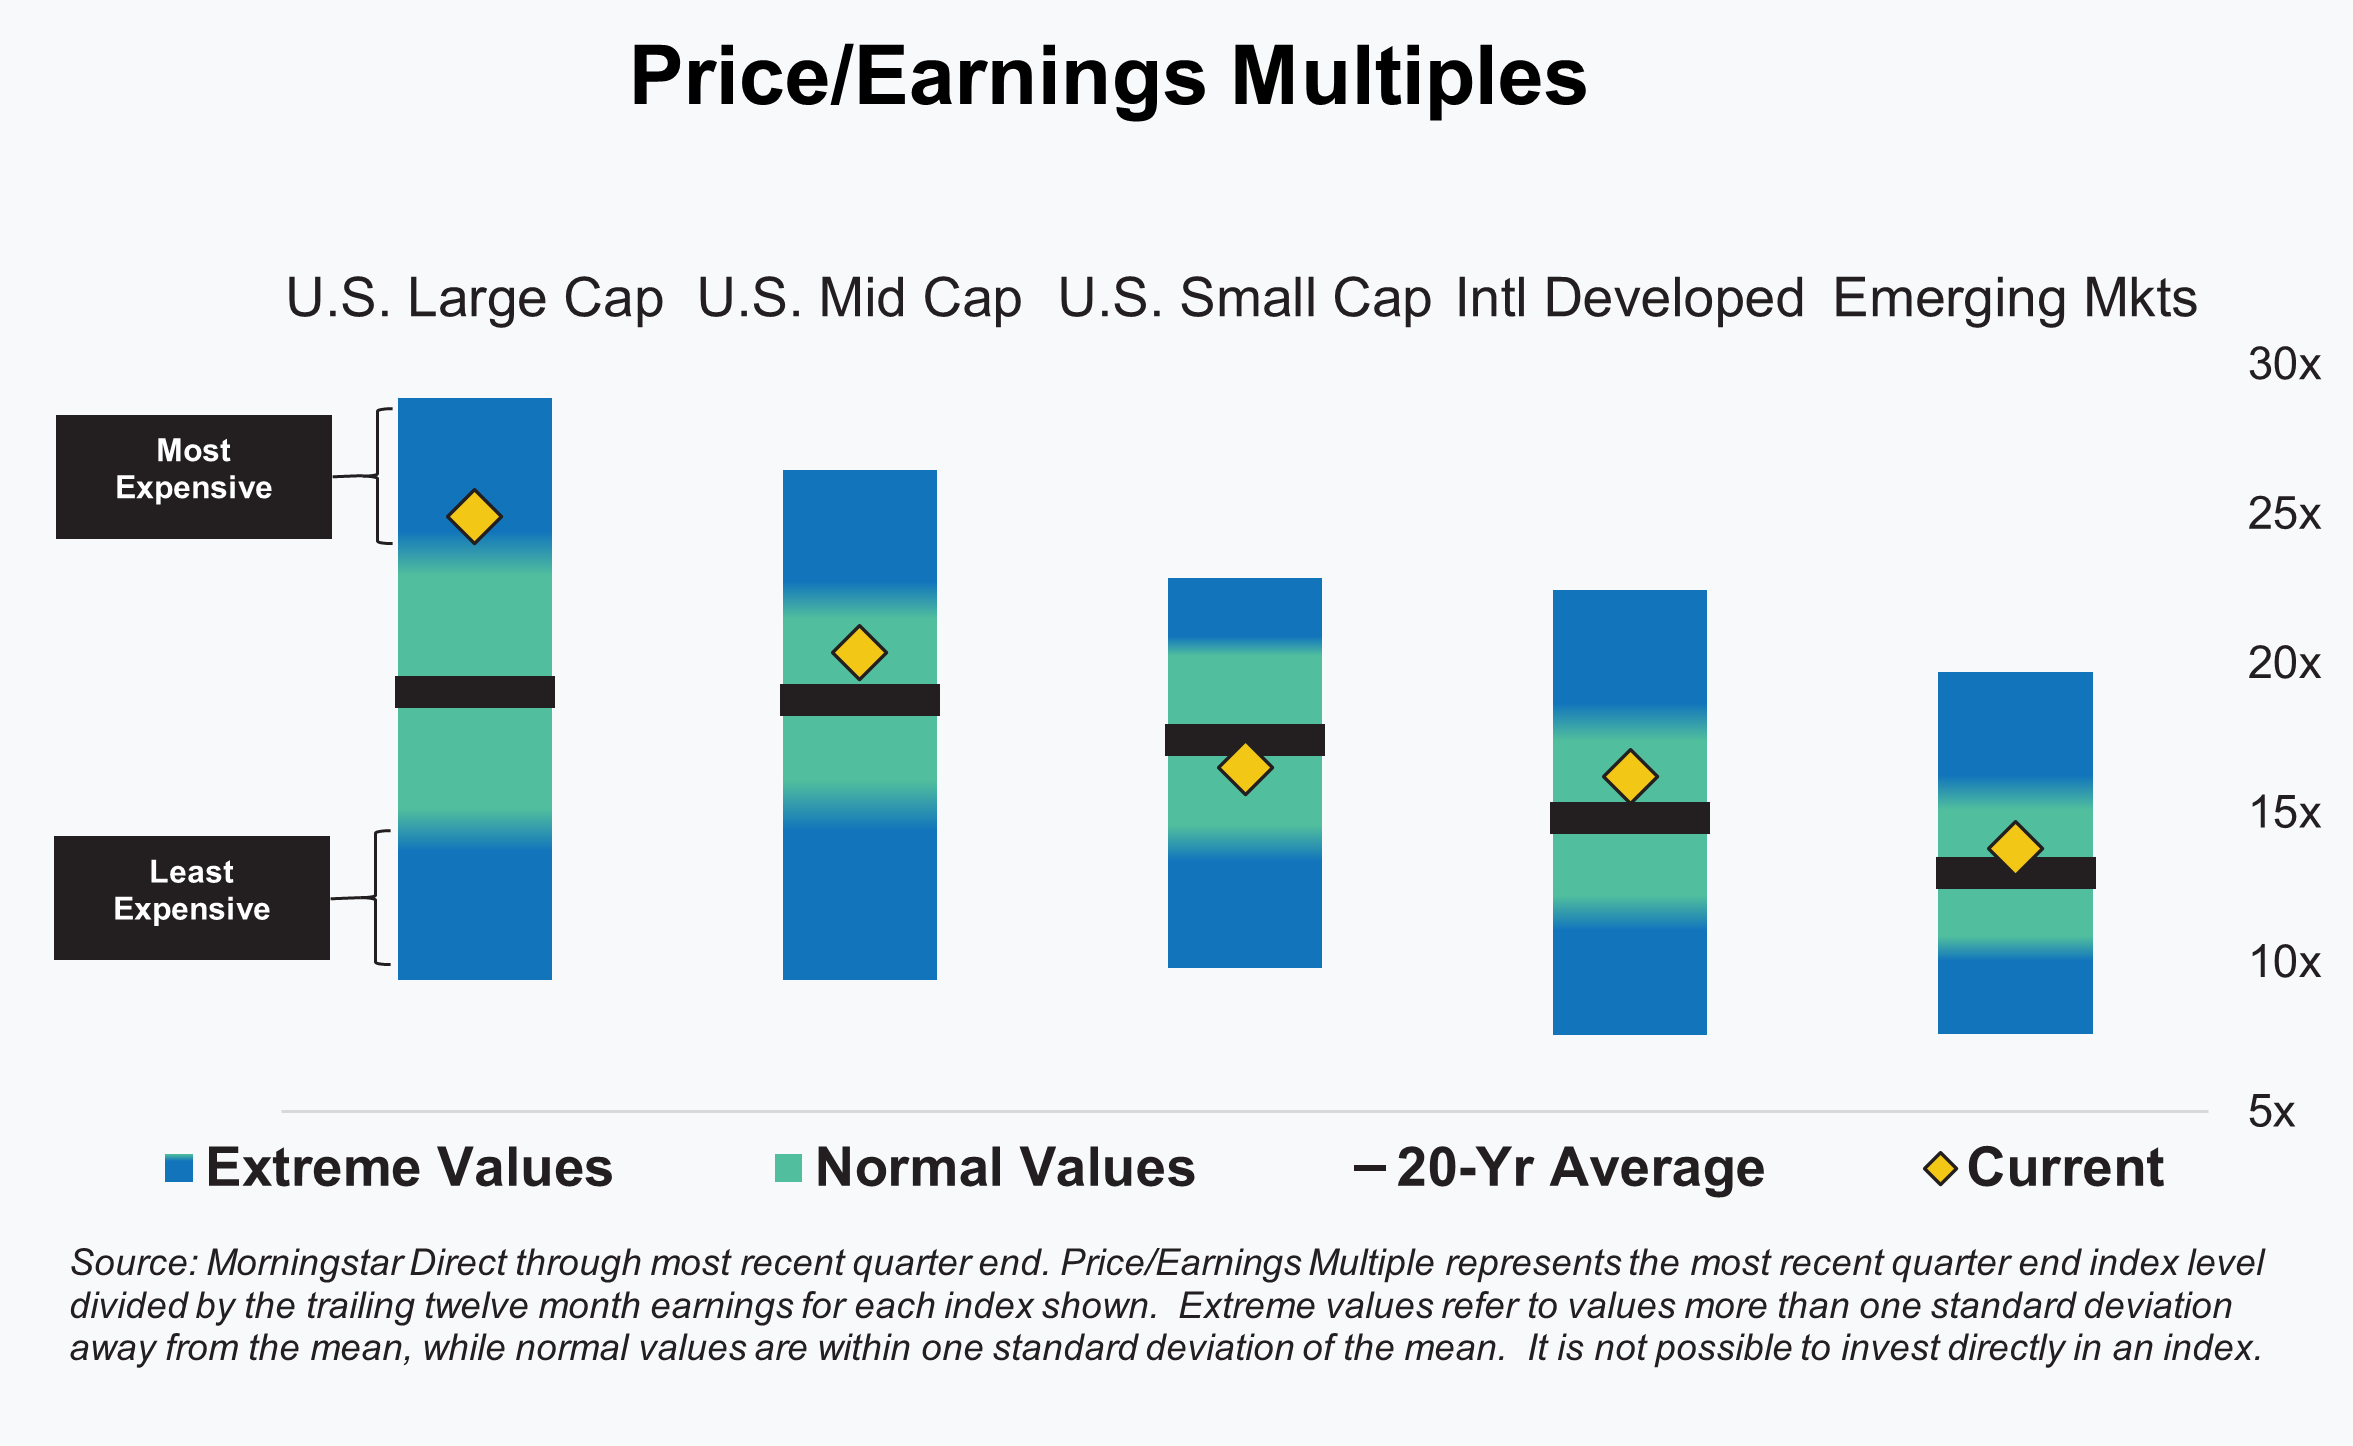
While we look at more metrics than just Price-to-Earnings multiples, PE multiples still do a good job of summarizing our views on equity valuations and where we see opportunities. U.S. large cap (specifically large cap growth) valuations are not as expensive as they were a few months ago, but we’d still categorize them as expensive. Most other segments we’d categorize as average or just on the wrong side of average (i.e. more expensive than average). The only exception currently is U.S. Small Cap which is slightly cheaper than its 20-year average.
Fixed Income
Unlike equities, bonds enjoyed more of the positive aspects that can come from volatility. While the term tends to have a negative connotation, volatility can describe both positive and negative price movements. During the quarter, bonds experienced a high degree of volatility, but those price moves were to the benefit of bond holders and drove a reasonably strong period of returns. The benchmark index, the Bloomberg Barcap Agg, gained 2.8% during the quarter.
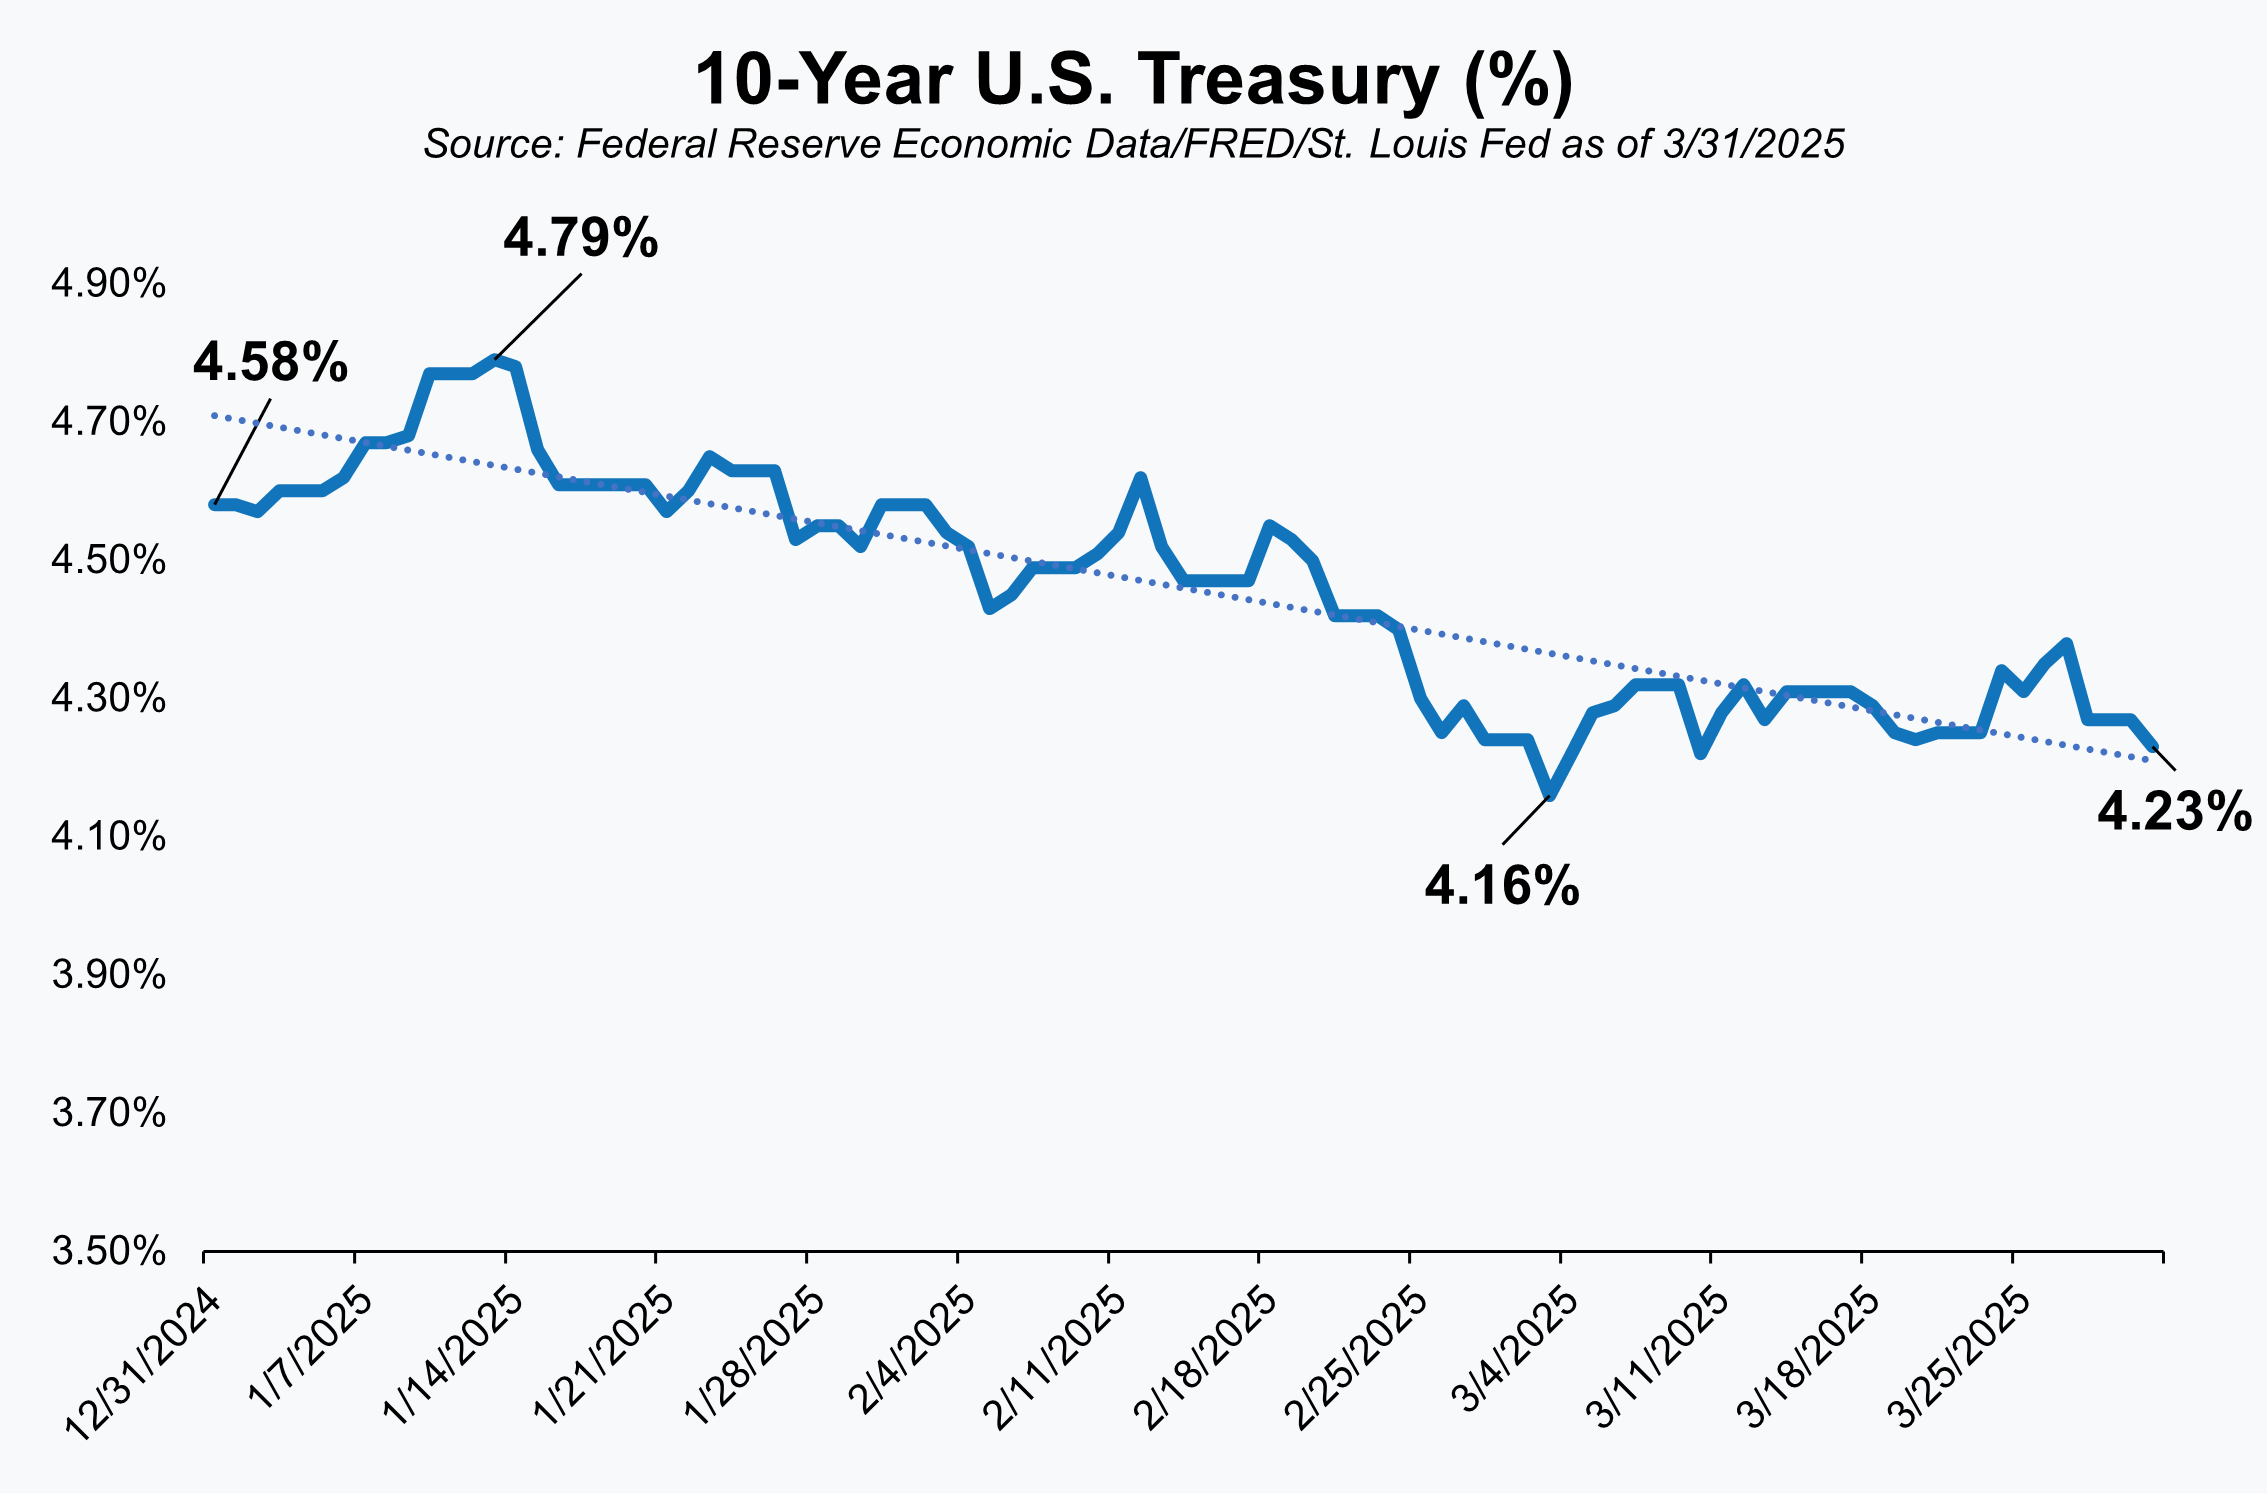
After starting the year at 4.58%, renewed concerns about inflation drove the 10-Year U.S. Treasury yield to as high as 4.79% early in the quarter. While many of those inflation concerns still exist, softer economic data and a flight-to-safety amidst the equity market selloff pushed yields back down. The yield eventually dropped as low as 4.16% before rising a bit and ending the quarter at 4.23%. The end-of-quarter yield differed from its starting point by 0.35%, but yield for the benchmark Treasury had a range of 0.63% during the period.
As we communicated in a mid-March note to clients, we made several changes to portfolios during the quarter, some of which involved fixed income. We entered 2025 with an overweight to fixed income due to yields that we found attractive and equity markets that appeared somewhat expensive. While we still find fixed income yields to be attractive, the drop in equity prices (and valuations) during the quarter allowed us to do some opportunistic repositioning. We still remain overweight fixed income, but the size or amount of the target overweight has been cut in half.
The other change we made was within the asset class as we increased the overall credit quality of our fixed income by selling all or portions of positions in strategies like corporate high yield (also known as “junk bonds”) and emerging market debt. Both were areas that had done well in recent years, but as a consequence had also grown increasingly expensive.
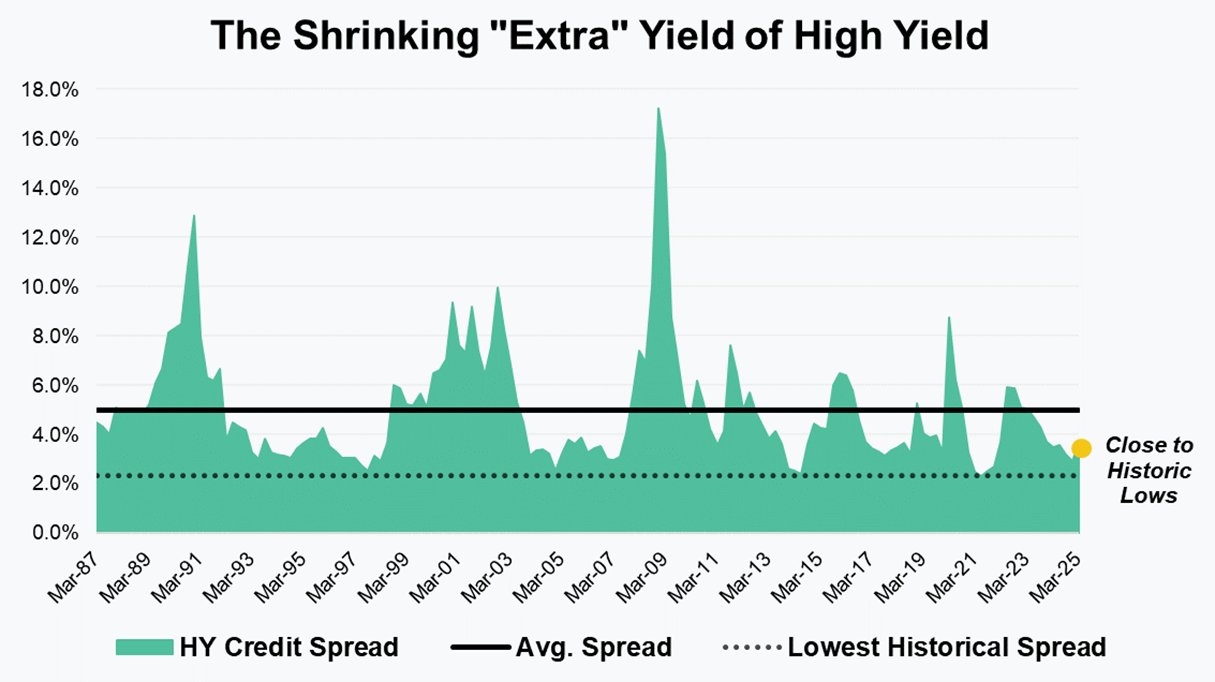
When we think about positioning to have a higher level of credit risk in portfolios we focus on how much additional return we can expect for that added risk. We want to understand if we are being adequately “compensated” for that risk in the form of higher yield/expected return. As this graph comparing U.S. Corporate High Yield to the 10-Year U.S. Treasury shows, that “extra” yield (typically referred to as a Credit Spread) has been shrinking and is now just barely above historic lows. There are both fundamental and technical reasons that help explain or justify the tighter spread, but even adjusting for those we felt compelled to reduce our exposure.
Commodities + Real Assets + Alternatives
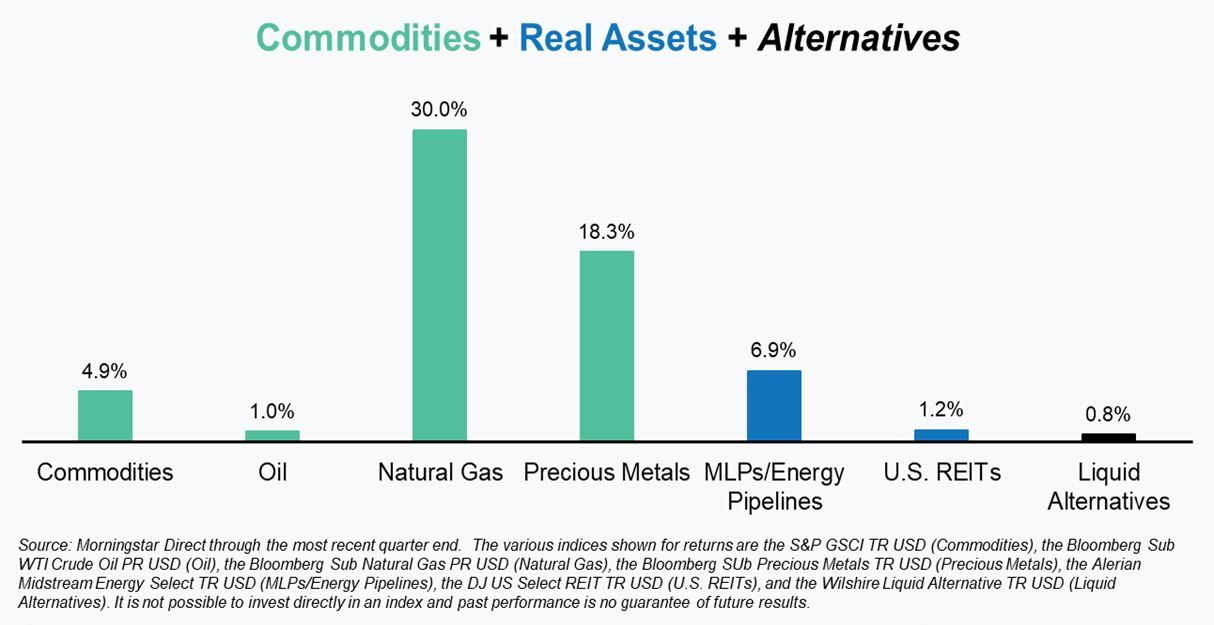
It was generally a positive quarter across some of the bigger segments of commodities and real assets, as well as an index that tracks liquid alternative strategies. There are always outliers, however, and Natural Gas and Precious Metals certainly were standouts to the upside. Precious Metals, in particular, stands out due to the performance of gold which benefitted from the increasing levels of economic and geopolitical uncertainty.
For clarification purposes please note that our listing of commodities, real assets, alternatives and returns for the period shown is far from an exhaustive list. We’ve chosen to show broad indices or specific strategies because they tend to be areas of interest for investors and/or areas that we own in client portfolios.
In a world of heightened uncertainty and more price volatility, building an element of resiliency into portfolios is more important than ever. Fixed income is often expected to play that role for investors, but we believe including alternative strategies in that effort is equally important.
As we’ve written about in the past, alternatives is not so much an asset class as it is a collection of investment areas, types, and strategies that have unique characteristics and fall outside of traditional stocks and bonds. In keeping with that uniqueness, returns tend to be rather disparate or only loosely connected. That uniqueness is also what makes them appealing from a resiliency standpoint. Returns that are less correlated to traditional markets and to each other creates an opportunity to make money in many different types of environments – not just when stocks and bonds go up.
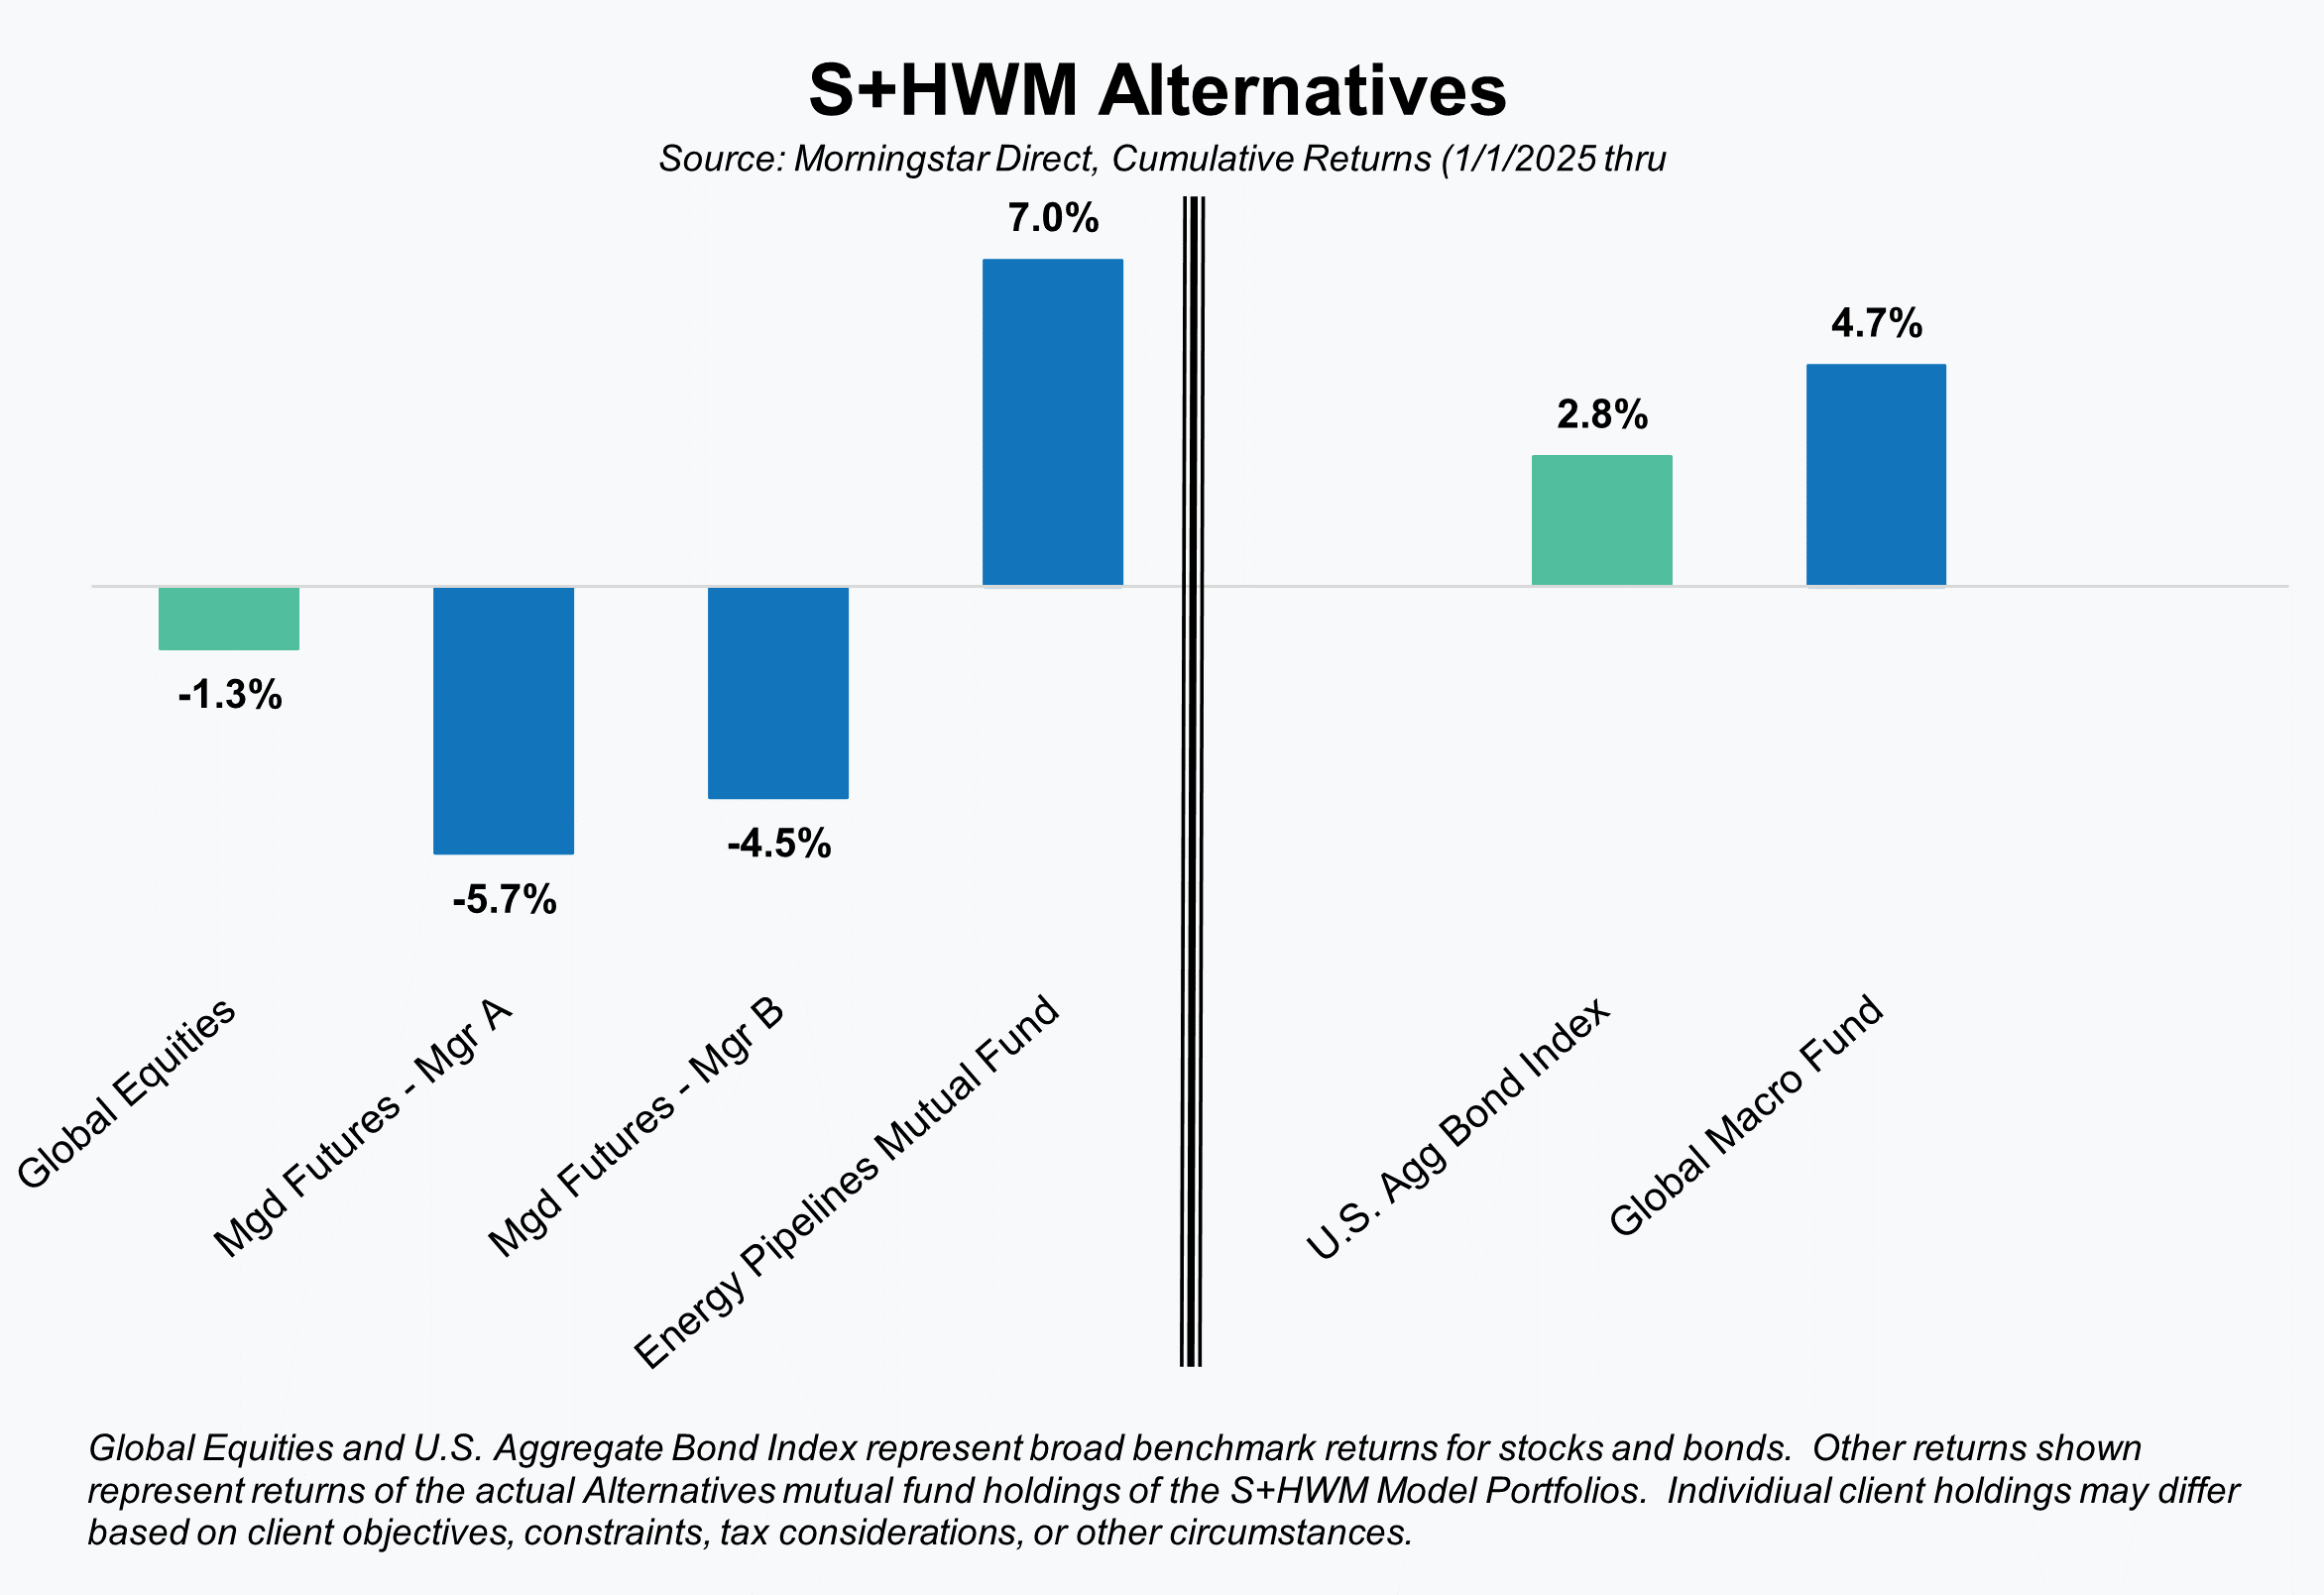
We saw some of that independence of return this past quarter in the strategies we hold in a typical portfolio.
Our allocations to an energy infrastructure fund and a global macro fund enjoyed stellar returns for very different reasons, while our two trend-following managed futures strategies had negative results. It would obviously be better if all four strategies had positive results, but given the intentional focus on independent return drivers and minimal correlation, that would be somewhat unusual over a short timeframe. Over a long timeframe, of course, we expect them all to generate positive returns – just not necessarily all at the same time or rate.
As always, we are available and ready to answer your questions on these or other topics related to investments and financial planning. Please call us at 404-874-6244 or email us here.
Unless stated otherwise, any estimates or projections (including performance and risk) given in this presentation are intended to be forward-looking statements. Such estimates are subject to actual known and unknown risks, uncertainties, and other factors that could cause actual results to differ materially from those projected. The securities described within this presentation do not represent all of the securities purchased, sold or recommended for client accounts. The reader should not assume that an investment in such securities was or will be profitable. Past performance does not indicate future results.
Want to get insights right to your inbox?
Subscribe to our newsletter to get inside access to timely news, trends and insights from Smith and Howard Wealth Management.
 April 7, 2025
 Back to Insights