ARTICLE
Market Recap + Outlook | Fourth Quarter 2020
by: Smith and Howard Wealth Management
An In-Depth Look at Markets Through Year-End
Cut to the Chase: Markets experienced mild weakness in late October, but that didn’t last long as markets spent the final two months of the year surging higher. Much of this activity can be attributed to the news of positive results from vaccine trials and the end of uncertainty about the election results. All in all, investors who ignored the wild ride and maintained a steady course were rewarded at the end of the year.
After equity markets ended the 3rd quarter with a bit of a whimper, it was reasonable for investors to wonder if more weakness was to come in the 4th quarter as the number of coronavirus cases climbed and the hotly contested U.S. Presidential election lurked. The month of October did little to quell those concerns as early strength gave way to election anxieties in the latter half of the month.
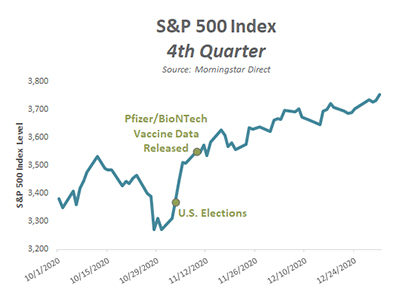
Fortunately for investors, October’s mild weakness would prove fleeting as markets spent the final two months of the quarter surging higher. As the S&P 500 Index 4th Quarter chart illustrates, markets began to turn higher just ahead of the U.S. elections. Investors appeared to cheer the increasingly likely result that no single political party would hold the Presidency and both houses of Congress. Markets then got a further boost the morning of November 9th as Pfizer and BioNTech became the first to release positive vaccine test results. Moderna and AstraZeneca, as well as research efforts in Russia and China, would follow shortly with their own positive vaccine announcements. The combination of perceived positives was enough to keep markets rallying through the end of what has been a truly historic year.
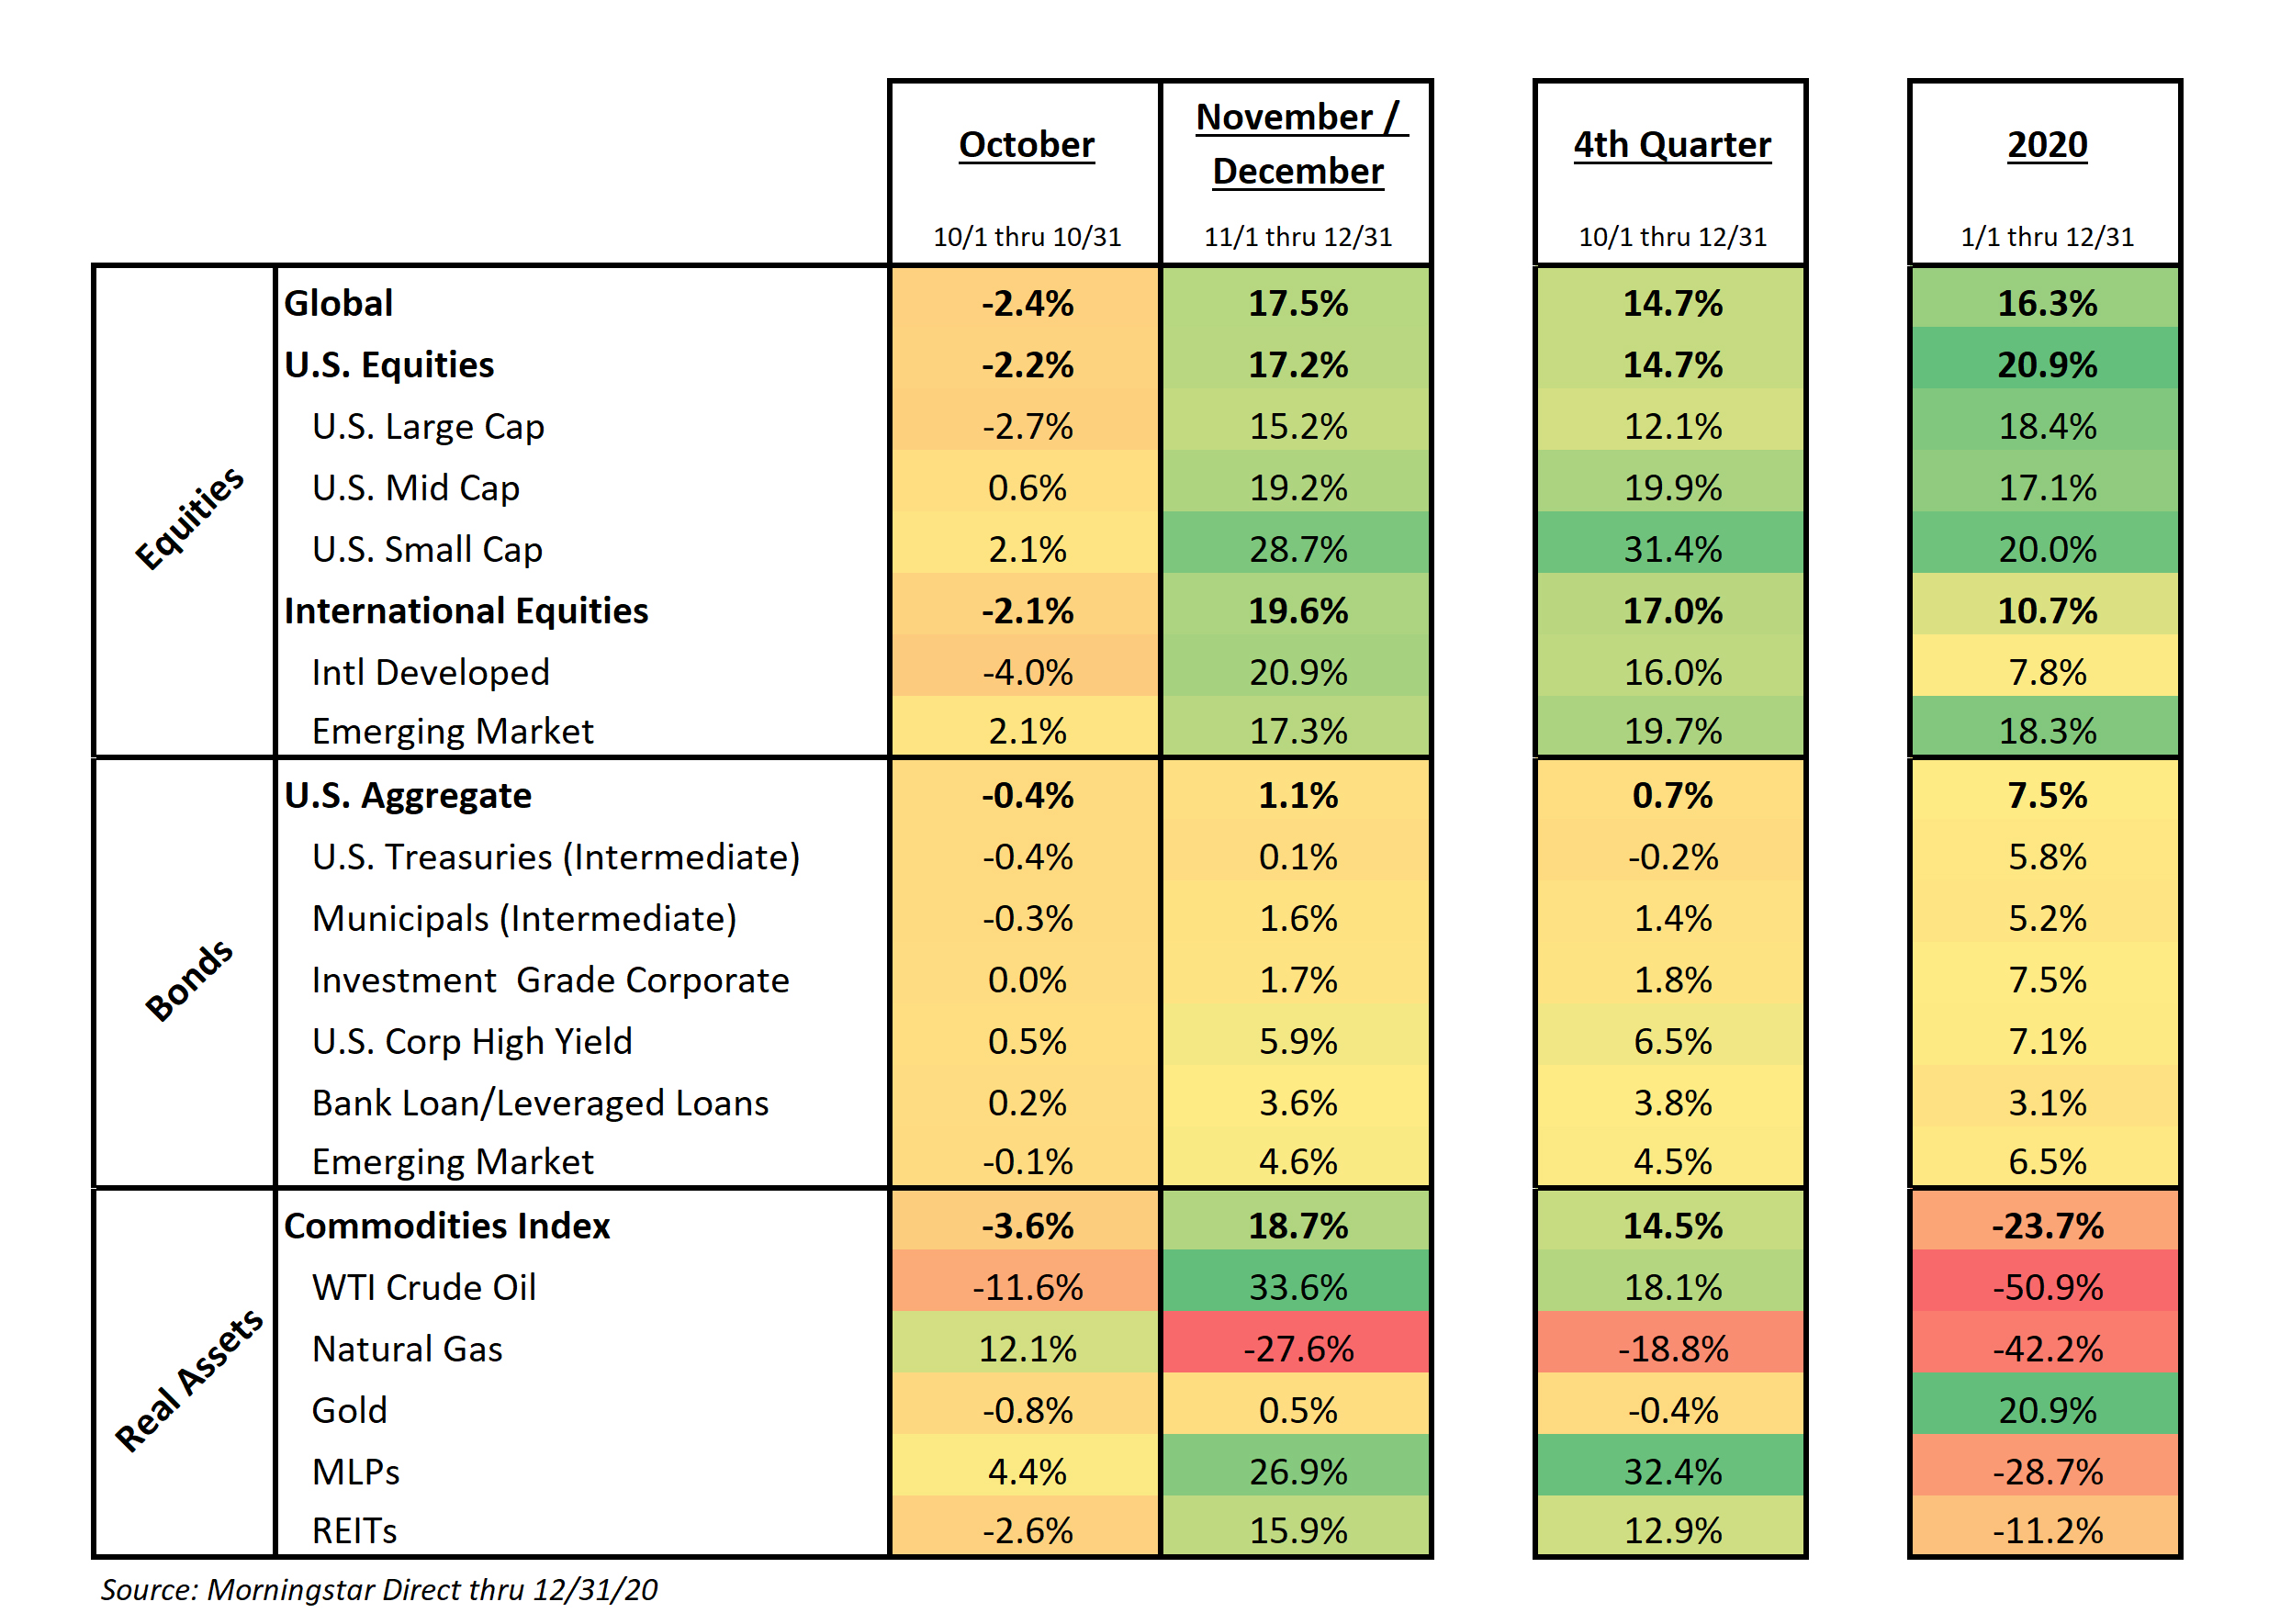
Investors would have saved themselves a lot of stress and anxiety during 2020 if they’d simply managed to pull a “Rip Van Winkle”. In fact, looking at our “Heat Map” (specifically the far right, 2020 column) probably wouldn’t even indicate to a sleepy investor that anything out of the ordinary occurred over the course of the last 12 months. Equities and bonds were both strong, but certainly nothing out of the ordinary. We all know, however, that the path to arriving at those returns was not ordinary by any measure. We may still have a long way to go in fighting the virus and nurturing the burgeoning economic recovery, but those investors that endured the market swings during 2020 have been rewarded.
Equities
Recap – After managing to get back to even during the 3rd quarter, global equities turned definitively positive during the 4th quarter. To borrow a concept from Lexus and their popular holiday commercials, an unremarkable October was followed by a November to Remember. Global equity markets, as measured by the MSCI All Country World Index, had their single best percentage month gain ever and U.S. Small Caps jumped more than 18% during the month.
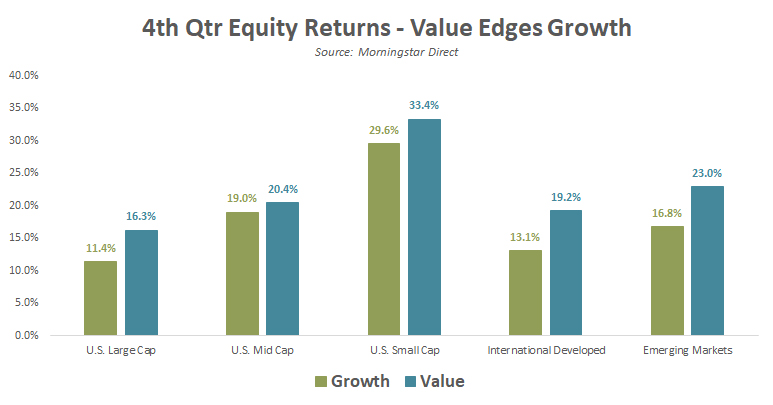
Equities appeared to take a favorable view of U.S. election results and, like everyone else, cheered the numerous positive vaccine announcements. The push higher was broad-based, but we did see a bit of a reversal of the growth outperformance that we’d highlighted last quarter. Growth businesses and stocks, which had disproportionately benefitted from the work from home movement, were positive during the quarter, but trailed their value counterparts. Value stocks, which include a higher proportion of old-line industries like financials, energy and industrial stocks, surged on the vaccine news as investors appeared to shift from the work from home trade to the economic recovery trade.
As the following chart shows, the shift towards value was across market capitalizations and geographies. The value outperformance was most pronounced in international markets, both developed and emerging, as well as in the U.S. Large Cap space. It remains to be seen if this one quarter of outperformance is the start of a larger, sustained shift or simply a short-term rotation.
Outlook – expensive, fair or even cheap?
The strong recovery in stocks since the March lows has again made this a difficult question, with no surefire answer. While it may sound like a copout, the answer really is “it depends.” It depends on how one measures valuations and how one defines expensive, fair or cheap.
The easiest way to illustrate this is by looking at an example and two popular (at least in our world) measures of broad equity market valuations. In the following chart, we will attempt to show why two reasonable investors can arrive at very different conclusions or outlooks in regard to today’s stock market.
We’d be happy to spend more time defining the various terms and calculations included in this illustration during upcoming meetings and calls, but for purposes of this writing we’ll stick to a high level summation.
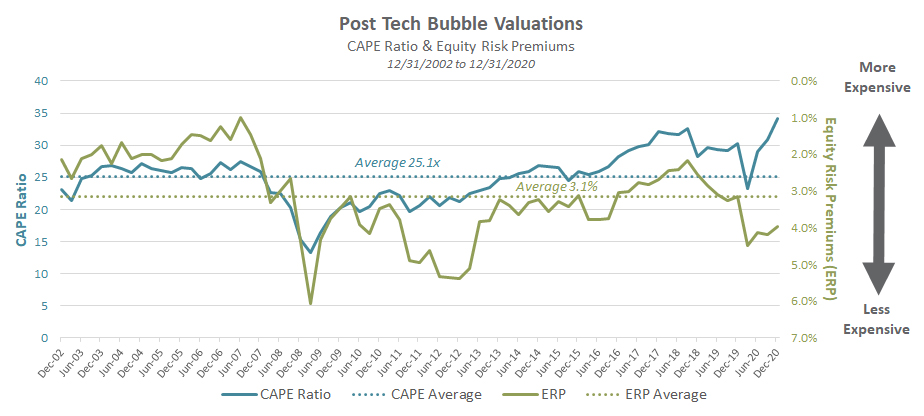
The blue lines (solid and dotted) and the left hand scale relate to an earnings multiple valuation measure. This compares the current market level to the last 10 years average earnings of the market. The higher the number or line the more expensive that market is. The dotted blue line shows that the average since the end of 2002 was roughly 25.1 times. The current level is notably higher than that today at 34.2. By this measure, the market has not been this expensive since the height of the tech bubble.
The green lines (solid and dotted) and the right hand scale also look at the earnings multiple, but this adds in another element – interest rates or the yield on U.S. Treasury bonds. We’ve written about this in past writeups, but this is referred to as the Equity Risk Premium or ERP. Rather than looking solely at equity valuations in a vacuum, this allows us to incorporate or compare the attractiveness of stocks with other options an investor has (in this case bonds). By this measure, we can see that the average ERP over this time period has been 3.1%. Today that figure is 4.0%, which on this scale means that stocks are less expensive than the average – the complete opposite conclusion when juxtaposed with the blue lines outcome.
In managing portfolios or formulating a market opinion, we believe investors should consider both types of measures. Both can be useful, even when they don’t align or give a consistent signal – like today. In our case, the blue line or CAPE Ratio tells us that we need to be thoughtful and cautious with our equity exposure, while the green ERP line reminds us why it would be unwise to be too negative or cautious on stocks in general.
As we’ve consistently pointed out the last few years, broad measures of market valuations that focus solely on the U.S. Large Cap market (like the above) may not show all the pockets of opportunity that exist. We believe that investors willing to shift their allocations towards value, smaller capitalization and international stocks are likely to fare better in the long run as those areas continue to have more attractive valuations, both compared to their own history and relative to bonds.
Bonds
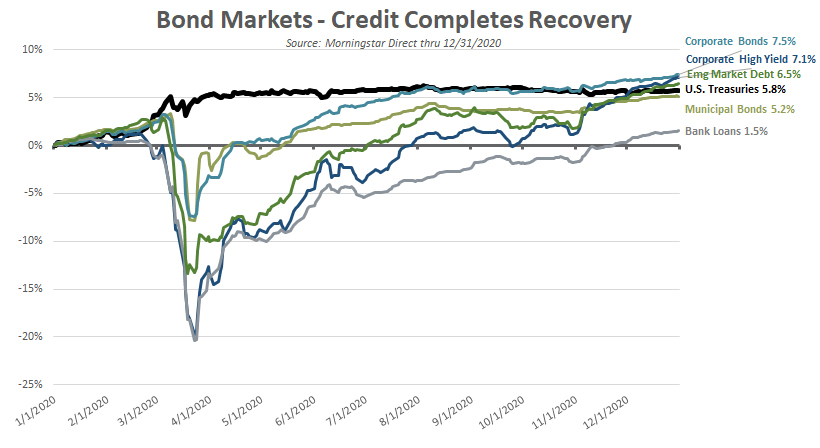
Recap – For a third straight quarter, investors were rewarded for their willingness to invest in the lower credit quality segment of investment grade bonds and non-investment grade markets. The Bloomberg Barcap Aggregate U.S. Bond Index, made up of investment grade bonds, returned a modest +0.7% with Corporate bonds (+1.8%) far outpacing U.S. Treasuries (-0.2%). The outperformance of credit was far more pronounced in the non-investment grade space as more impressive returns were achieved in U.S. Corporate High Yield (+6.5%), Emerging Market Debt (+4.5%), and Bank Loans (+3.8%). The non-investment grade markets remained behind the benchmark on a full year basis, but investors who opportunistically added exposure during the March selloff (or shortly thereafter) had an opportunity to capture significant value over the remainder of the year.
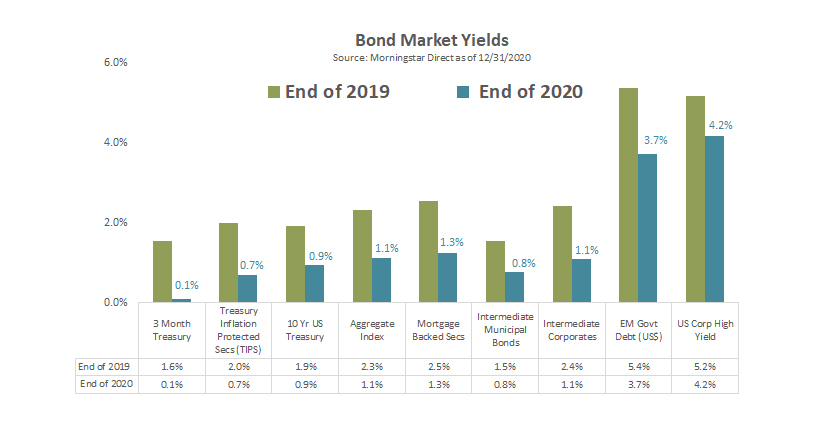
Outlook – As we outlined last quarter, nearly all segments of the bond market now have yields that are below where they stood at the end of 2019. That is illustrated in the accompanying Bond Market Yields graph, in which the green bar shows yields as of 12/31/19 and the blue bar yields as of 12/31/20. We stated at the end of 2019 that we believed bonds to be expensive, so it should come as no surprise that we again have come to that same conclusion.
The non-investment grade credit portion of the market, something we often refer to as Opportunistic Fixed Income, is one in which we remain active. After cutting our exposure in January 2020, we used the higher yield levels available in early April to add this exposure back to portfolios. With those bonds surging again the last few months and yields dropping, we expect to continue to manage this exposure lower as we enter 2021. We remain constructive on credit fundamentals within the space, but cannot ignore the increasingly expensive valuation levels.
Real Assets
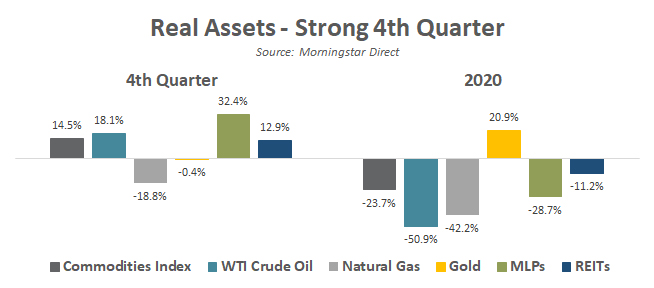
Recap – For the first time during 2020, gold was not a notable performer within the real assets or commodities space for a quarter end. That distinction goes to energy pipelines, which surged greater than 32% during the 4th quarter. Despite the fact that most energy pipelines transport natural gas (-18.8% during the quarter), the sector saw sentiment improve with the bounce in oil prices (+18.1%). REITs also experienced a bounce during the quarter. The strength in areas like the pipelines, oil and Real Estate Investment Trusts (REITs) was not enough, however, to offset the losses experienced earlier in the year. Gold, an underperformer for the quarter, was still the only major area of note to finish on the positive side of the ledger for the full year.
Outlook – At Smith and Howard Wealth Management we don’t typically invest directly in commodities. Commodities themselves do not pay interest or produce a cash flow, making them difficult to value or invest in directly. We will, however, invest in commodity-related businesses and allow our managers the flexibility to invest in such areas. REITs and energy pipelines (often referred to as MLPs) are two areas that we continue to monitor and believe can be part of a long-term solution or component of a portfolio. Energy pipelines, hard hit by the downturn, remain at valuation levels and dividend yields that we find attractive.
Our Deeper Dive highlights noteworthy and newsworthy items in the past twelve months. To read our 2020 year-end summary click here.
As always, each advisor at Smith and Howard Wealth Management is available and eager to answer your questions on these or other topics related to investments and financial planning. Please call us at 404-874-6244 or email us here.
Unless stated otherwise, any estimates or projections (including performance and risk) given in this presentation are intended to be forward-looking statements. Such estimates are subject to actual known and unknown risks, uncertainties, and other factors that could cause actual results to differ materially from those projected. The securities described within this presentation do not represent all of the securities purchased, sold or recommended for client accounts. The reader should not assume that an investment in such securities was or will be profitable. Past performance does not indicate future results.

Subscribe to our newsletter to get inside access to timely news, trends and insights from Smith and Howard Wealth Management.
 Back to Insights