ARTICLE
A Deeper Dive: When does 8 = 10? | Third Quarter 2018
by: Smith and Howard Wealth Management

In a nutshell: In our 2nd Quarter CFO Report we discussed why today’s investors may need to readjust their expectations for future stock and bond market returns compared to what investors have experienced over the last 50 years. The primary rationale for this statement was the elevated current valuations that exist today. The other reason is that returns over that period were accompanied by meaningfully higher inflation than we are seeing now. The headwinds of valuation still exist but are somewhat offset by a lower inflationary environment.
For insights on our thinking regarding future return expectations and the impact inflation has on “real” returns, read below.

Over the last 50 years the S&P 500 has compounded at an annualized rate of return of just over 10% and the average yield for a 10-Year U.S. Treasury has been roughly 6.4%. When we talk with clients, particularly those that experienced much of that time period, we find that those experiences and figures still drive their current return expectations. There is obviously a reasonable foundation for that, but we’d caution investors that the next decade may not look like the last half century.
This statement and cartoon, which appeared in last quarter’s Your CFO Report generated a number of good questions and conversations with clients. We thought it worthwhile to dig a little deeper and provide some additional context.
Elevated valuations for both stocks and bonds and the impact on future returns is something we stressed throughout the prior writeup. Obviously, the statement by itself does not paint a particularly optimistic tone, but we believe that is at least partially due to the statement focusing on nominal returns rather than real returns. Let’s pause for a moment to define what is meant by nominal and real in the context of investments returns:
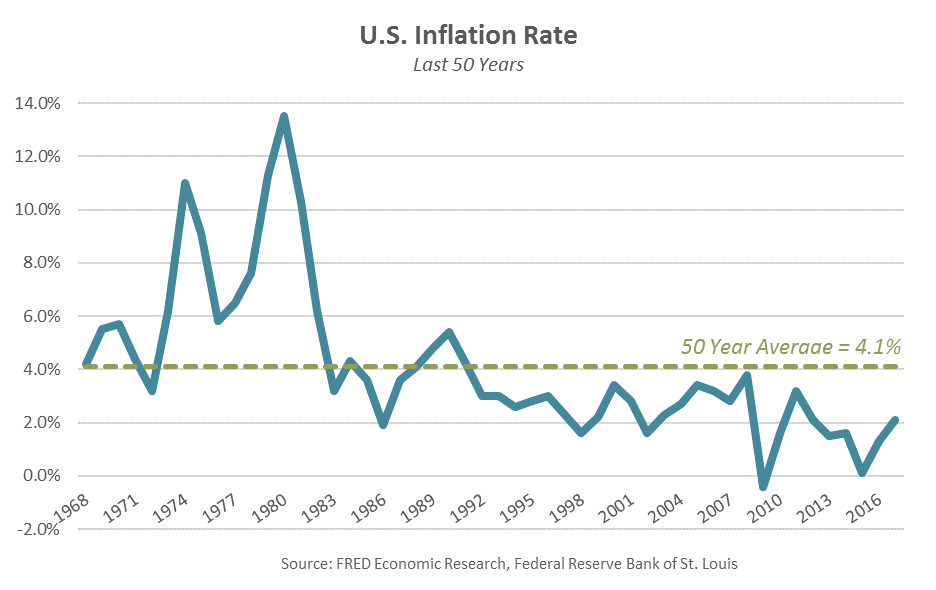
Investors invest, presumably, to increase their net worth and purchasing power (i.e. how much stuff their money will buy today or in the future).Given the impact we all know inflation can have on the prices of the things we want to buy, it makes little sense to think about investment returns without also considering the impacts of inflation. That is especially true when we think about returns over the last 50 years. Inflation has been relatively tame over the latter half of those 50 years, but as the chart of the U.S. Inflation Rate (right) shows that was certainly not the case during the first half.
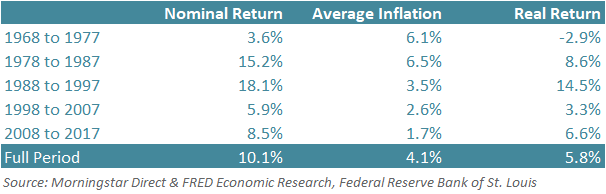
What does all this mean for an investor? The big picture takeaway is that the 10% annualized rate of return for the S&P 500 over the last 50 years is the nominal, headline figure and while not “fake news”, it also does not tell the full story. As we all know, headlines can be misleading and don’t incorporate valuable context. The context in this case is that inflation was a significant factor for much of this period and an investor’s real return was something meaningfully less than the 10%. In fact, the accompanying table shows that not only did inflation play a significant part in the 10% figure, but the 20-year period from 1978 through 1997 made up a disproportionate amount of the return (nominal or real). Equities during that 20-year period benefitted from two major tailwinds – cheap initial valuations and falling interest rates that were the direct result of the successful efforts to curb higher inflation. Unfortunately, valuations and the direction of interest rates are more likely to be headwinds for equities today.
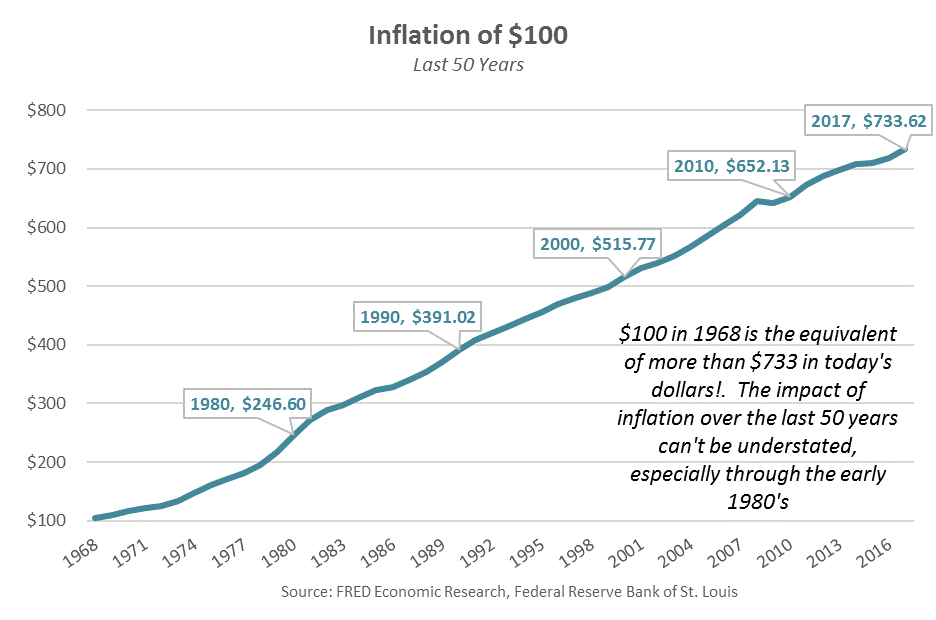
Due to the significant changes in inflation over time, we encourage investors to focus on real returns when comparing historical returns with future expectations. It makes the comparison more “apples to apples” and focuses on what investors should care more about: their real net worth and purchasing power. If you doubt the impact that inflation can have over time, the following “Inflation of $100” illustration may help. The graph illustrates the growth of $100 over the last 50 years at the average rate of inflation for each year. Just to keep the same purchasing power, a consumer or investor would have to have grown their $100 in 1968 to more than $733 today! The impact of inflation is real and often significant.
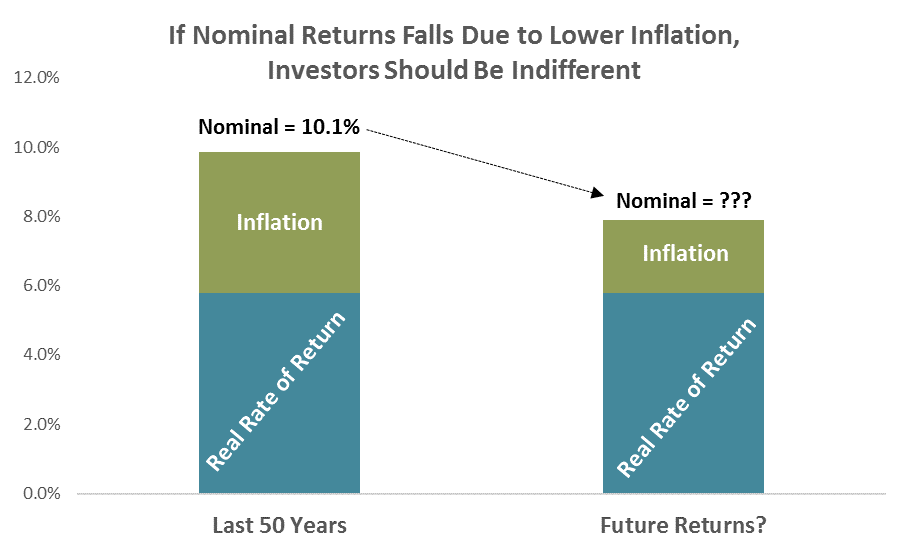
Why is this important today? With inflation at closer to 2%, we don’t need the same level of stock or bond returns to arrive at the same real portfolio growth as was experienced the last 50 years. An investor focused on real returns is indifferent between a 10% nominal rate of return with 4% inflation (last 50 years) and an 8% nominal return with 2% inflation. They both net to the same real return of 6%. To return to our original statement and the reason for this discussion – yes, nominal future return expectations likely need to come down, but fortunately the jury is still out on real returns. For more insight on the impact inflation can have over time, contact Brad Swinsburg 404-874-6244.
Explore more information on the third quarter of 2018 by visiting these links:
Market Recap: Third Quarter 2018
Market Outlook: Third Quarter 2018
On the Horizon: Third Quarter 2018
Unless stated otherwise, any estimates or projections (including performance and risk) given in this presentation are intended to be forward-looking statements. Such estimates are subject to actual known and unknown risks, uncertainties, and other factors that could cause actual results to differ materially from those projected. The securities described within this presentation do not represent all of the securities purchased, sold or recommended for client accounts. The reader should not assume that an investment in such securities was or will be profitable. Past performance does not indicate future results.

Subscribe to our newsletter to get inside access to timely news, trends and insights from Smith and Howard Wealth Management.
 Back to Insights