A Deeper Dive: What is the Market Going To Do This Year? | Second Quarter 2018
by: Smith and Howard Wealth Management

In a Nutshell:
Nobody really knows with any certainty what the equity market is going to do over the course of a year.
That doesn’t stop the question from being asked. It may seem to be a simple, straightforward question, but it is neither simple or straightforward. Returns in hindsight can be broken into three components – Multiple Expansion, Earnings Growth, and Dividend Yield. Dividend yields may be fairly predictable, but the other two components are not, making the time-honored question of “so what is the market going to do this year?” an impossible question to answer with conviction.
For insights on our thinking regarding the answer to every investor’s favorite market question, read below.
Meetings with clients and those who are interviewing us as their potential wealth advisor vary tremendously and cover a broad spectrum of topics. While there are typically some common themes and questions, no two meetings are the same. There is, however, one question that is inevitably asked – “so what is the market going to do this year?”. A seemingly simple and understandable question, but also one that is impossible to answer.
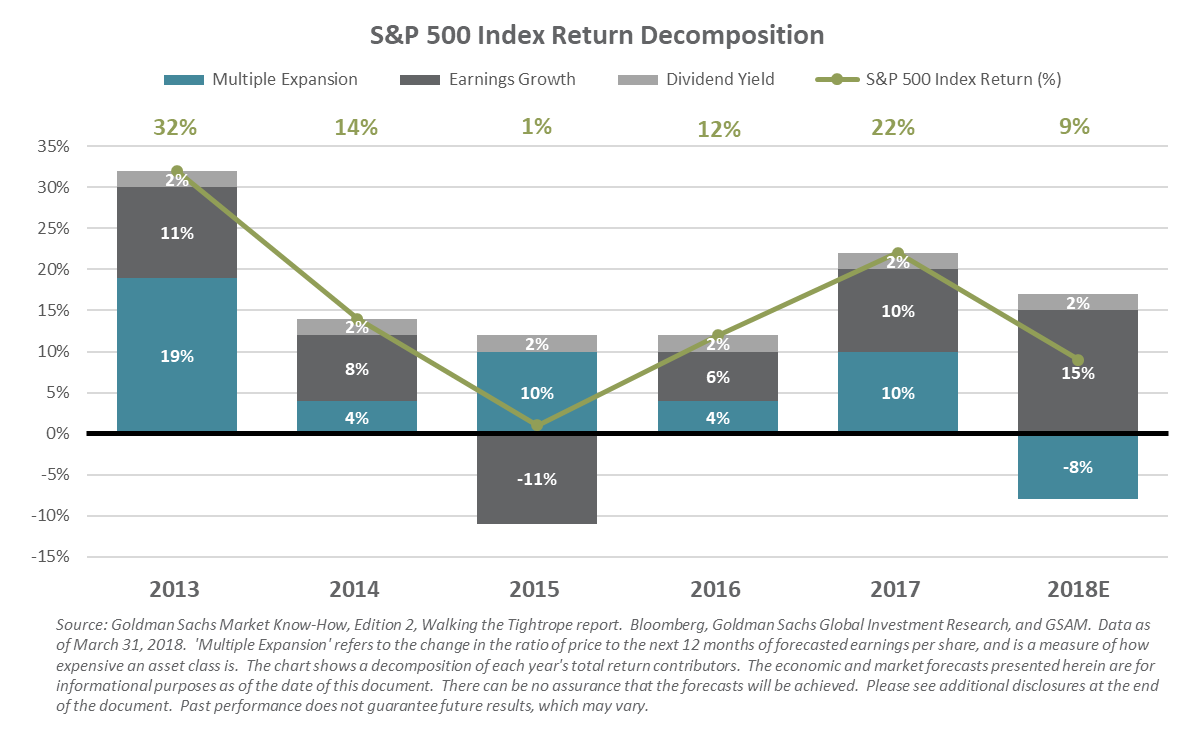
To be fair, most investors do understand that any answer is purely a best guess. That fact doesn’t stop the question nor does it stop industry professionals from offering up their best “guesstimate”. In fact, investment professionals who attempt to refrain from answering are often viewed as less knowledgeable or lacking confidence. Given the history of market forecasting, it seems it should perhaps be the other way around. Why is market forecasting so difficult? In a recent publication, Goldman Sachs included an interesting graph (recreated below) that may help. In the graph you’ll see the last few years of returns broken into three components: Multiple Expansion, Earnings Growth, and Dividend Yield. The summation of the three leads to the full year return figures across the top.

The graph does a very nice job of clearly summarizing what has driven or may drive equity market returns. It almost gives the impression that it’s something that should be relatively straightforward to forecast. Unfortunately, as I’m sure you can guess things aren’t always as simple as they appear. Let’s take a closer look at the three components.
Dividend Yield – Dividends tend to be the most consistent and predictable component of the three. Company dividend policies are made and managed with an eye toward sustainability. No management team wants to be responsible for cutting dividends, and increases are made only when a company is confident in their ability to maintain it into the future. Therefore, dividends tend to be stable and change only incrementally. At roughly 2% (see S&P 500 Index Return Decomposition graph) they also tend to be a small portion of the overall return. Unfortunately, the relatively straightforward nature of forecasting dividends is more than offset by the complexity of the other two components.

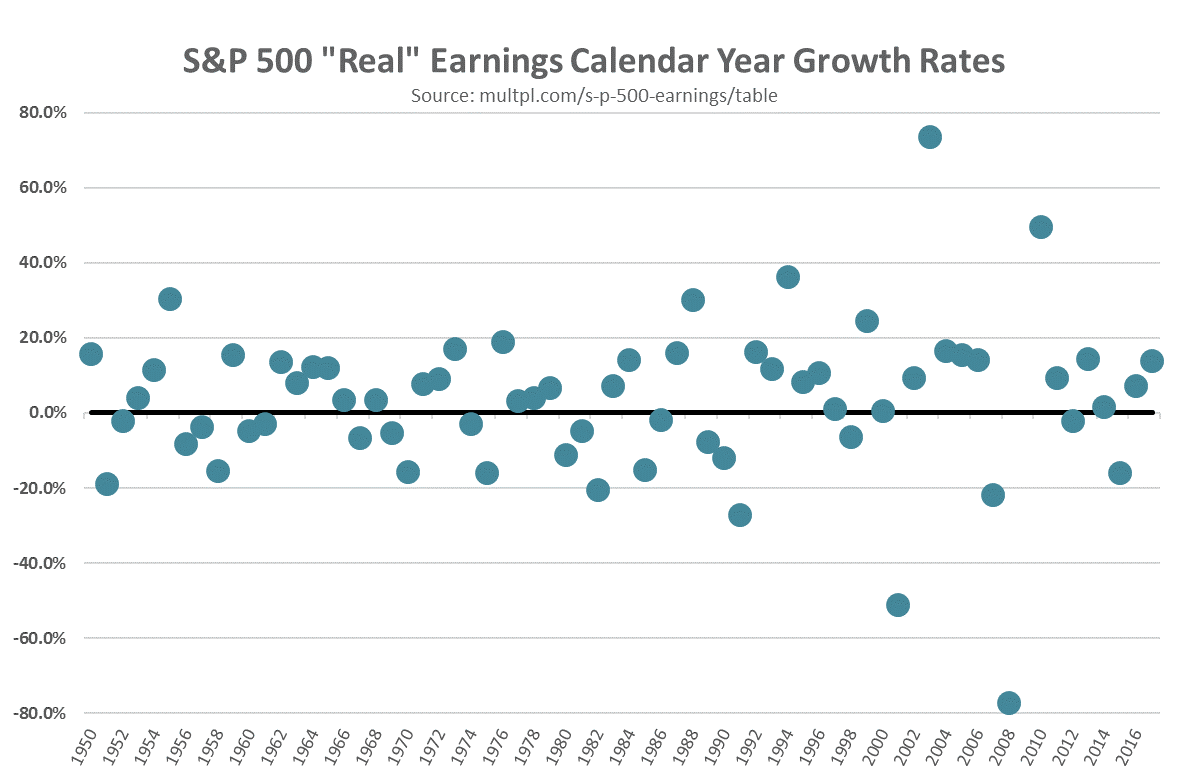
Earnings Growth – Most investors understand that earnings can be volatile, but it is likely underappreciated just how volatile they are. As the chart (S&P 500 “Real” Earnings Calendar Year Growth Rates) shows, the calendar year growth rate for S&P 500 earnings is in no way consistent. Each dot represents an individual year-over-year growth rate and it’s easy to see the randomness or lack of any discernable pattern. It’s worth mentioning that we’ve excluded what happened in 2009 when earnings rebounded more than 230% after the 2008 recession (it just didn’t fit on the graph!). Wall Street analysts are often derided for their inability to accurately predict market and company earnings, but judging by the scattershot nature of what has happened through history it becomes a bit easier to understand why.
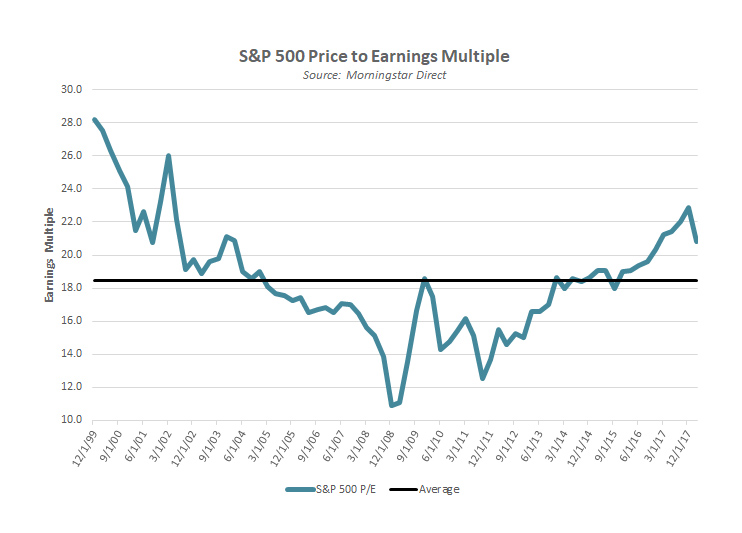
Multiple Expansion – We started with the easiest of the three components and now we must address perhaps the most difficult. The multiple expansion refers to the change in the multiple of earnings an investor is willing to pay for a particular investment. For example, a stock that trades for $20 per share that earns $1 per share would be said to be trading at a multiple of 20x. Imagine those same investors collectively wake up tomorrow and decide that the “right” multiple is actually 25x. The stock would jump from $20 to $25 or 25% despite nothing changing fundamentally with the company. As the accompanying chart indicates multiples do change over time and there is no such thing as the “correct” multiple, only the collective opinion of investors.
While the prior example of a multiple jumping from 20x to 25x overnight may seem unrealistic, it is so only because of our assumption about it happening overnight. As the chart S&P 500 Price to Earnings Multiples below shows, the range of multiples for the market can move significantly. Part of the reason for that is the behavioral component of investor sentiment. Other factors that impact multiples include changes in expected growth rates, interest rates, corporate tax rates, inflation rates, even the volatility of the inflation rate. These all impact what investors perceive as the “right” multiple at any given point in time. It’s why answering the question about what the market will do in any given year is less like checkers and more like three-dimensional chess.

Dividend yields may be relatively stable and even predictable, but over single-year time periods, earnings growth and multiples are clearly not. Fortunately, for longer time horizon investors, both are far more predictable as we extend the timeframe. The extreme variability of quarterly and yearly figures gives way to far more steady, consistent data points. Data points that can be used by long term investors, like our clients, to deploy capital with confidence and not rely simply on a best guess. To discuss the three components – Multiple Expansion, Earnings Growth and Dividend Yield which might help answer the question of how the market is going to do this year, contact Brad Swinsburg 404-874-6244.
Explore more information on the second quarter of 2018 by visiting these links:
Market Recap: Second Quarter 2018
Market Outlook: Second Quarter 2018
Unless stated otherwise, any estimates or projections (including performance and risk) given in this presentation are intended to be forward-looking statements. Such estimates are subject to actual known and unknown risks, uncertainties, and other factors that could cause actual results to differ materially from those projected. The securities described within this presentation do not represent all of the securities purchased, sold or recommended for client accounts. The reader should not assume that an investment in such securities was or will be profitable. Past performance does not indicate future results.

Subscribe to our newsletter to get inside access to timely news, trends and insights from Smith and Howard Wealth Management.