After a difficult first half of the year in which both stocks and bonds fell simultaneously, the third quarter got off to a more positive start. July and most of August saw both stocks and bonds rebound well off of their June lows. Unfortunately, the positive momentum eventually stalled out and in mid-September returns for both turned notably lower.
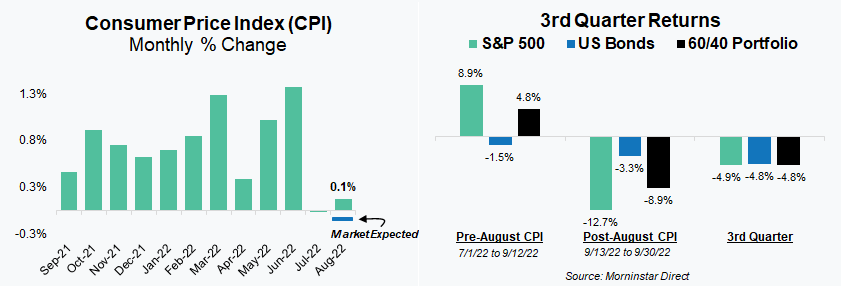
There is no shortage of issues weighing on markets. However, this past quarter and what occurred on September 13th made it clear that inflationary pressures remain at the forefront. The Consumer Price Index (CPI) report for August was released that day and was clearly a disappointment. After the July CPI report showed a small decrease in inflation month-over-month (MoM), the market had expected to see more of the same in August. Markets expecting to see a drop of -0.1% for the month were disappointed when the actual result showed a small increase of +0.1%. Movement in bond yields that day were relatively tame, but the same could not be said for equity markets. That day global equities fell -3.3% and the S&P 500 -4.3%, but more importantly the move started a pattern of negative results that continued through quarter end.
The differential between -0.1% and +0.1% is obviously not large, but it was enough to shift the narrative on inflation and what the Federal Reserve (the Fed) was likely to do with interest rates at their meeting the following week. Expectations shifted to a more aggressive response by the Fed which proved accurate as the Fed not only raised rates by 0.75%, but also communicated a more aggressive path for future actions that still caught many market participants by surprise.
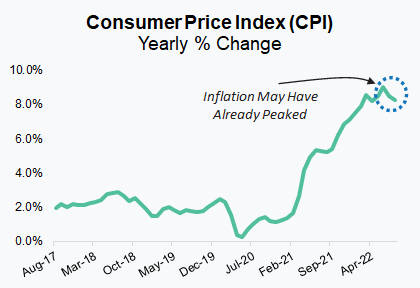
In the short period of time post the September rate hike, the Fed has started to come under increasing scrutiny about whether they are now overreacting or overcorrecting on inflation. By their own admission they were too slow to act and their view that inflationary forces were mostly transitory last year was simply wrong. Those arguing that the Fed is now acting too aggressively cite historical evidence that rate hikes have a lagged impact on the economy and that we are only now starting to see the impact from their first hikes last spring. They also note, as we show in the accompanying graph, that year-over-year inflation has already peaked and that forward looking projections show it continuing to decline.
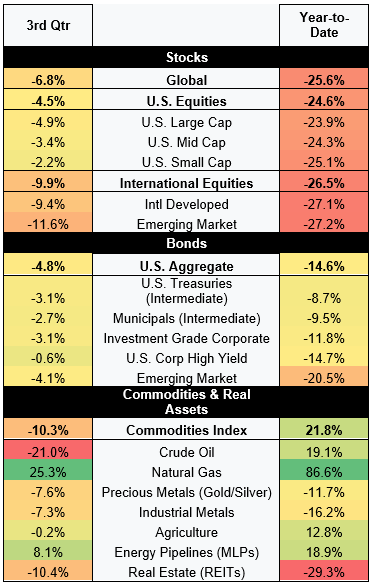
For more specifics on broad market returns we’ve again included our “Heat Map” table of returns which highlights just how deep and broad based the selloff has been over the last quarter and for the first nine months of the year. Unfortunately, there have just been very few places for investors to “hide”.
Equities
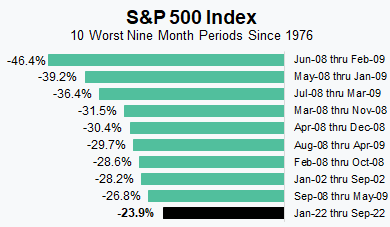
It has now been nearly nine months since the S&P 500 hit an all-time high. It probably feels like longer, however, to most investors. Market downturns usually “feel” like they’re never going to end, but investors have also grown accustomed in recent years to seeing markets fall and subsequently recover fairly quickly. Since the Great Financial Crisis (GFC), the S&P 500 has fallen more than 20% from peak to trough two times and more than 10% an additional two times. On average during those four instances, it has taken seven to eight months for the index to come full circle and return to its previous high. The current selloff appears poised to deviate from that pattern as the selloff has already lasted nine months and with a new low set at quarter end it has a long way to go before revisiting prior highs.The current downturn now also ranks as the 10th worst nine-month period for stocks dating back to 1976. That becomes even more notable when we realize that eight out of the ten worst periods were during the financial crisis of 2008/2009.
As we were preparing to write this quarter’s Your CFO Report we were struck by how little the issues and storylines weighing on markets had changed since our last Report. Some of the numbers and details have obviously changed, but as we wrote a few months ago the story remains about one current reality and one potential reality. The current reality is that high inflation is leading to lower equity valuations and prices. The potential reality relates to the Fed’s fight against inflation and whether their aggressive approach will prove to be an overcorrection and result in a protracted recession.
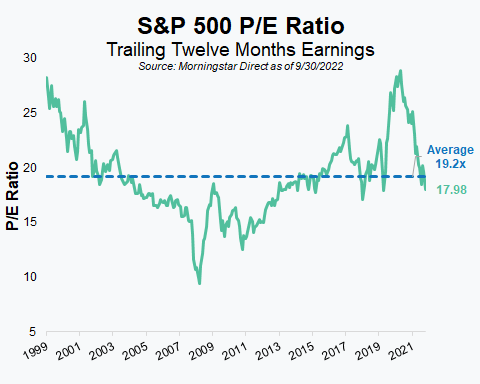
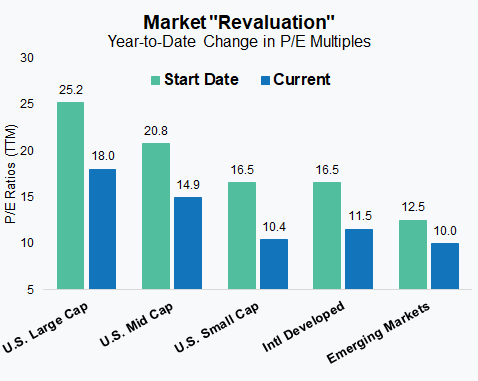
The silver lining, especially as it relates to recession possibilities, is that the more widely acknowledged the concern the less it is likely to take the market by surprise. In other words, even if the economy does enter into recession in 2023 it shouldn’t be a shock (consensus expectations put the probability at about 50/50 in the U.S.) and is likely already largely reflected in stock prices. Our two charts do a good job of illustrating how much market valuations have already fallen from the start of the year. The graph on the left shows just how much the Price to Earnings (P/E) multiple for the S&P 500 has dropped recently and the one on the right shows the change in P/E multiples across various market segments since the start of the year.
Pending recession or not, improved valuations increase our expectations for long-term, future returns. We continue to look for ways to take advantage of those improved valuations while being cognizant of the likelihood that markets will remain volatile and potentially see more downside before recovering.
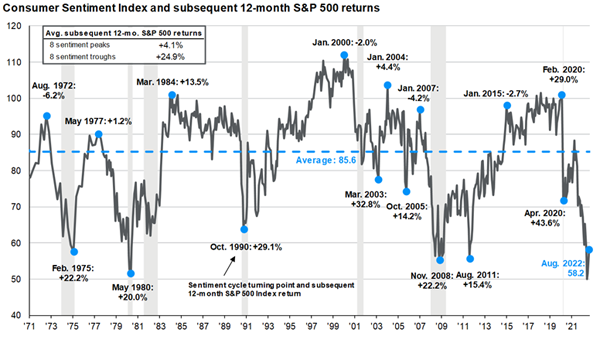
As we’ve always stressed, valuation may be a great predictor of returns in the long run, but it’s a poor market timing tool (as is everything else, by the way!). We don’t try and predict what markets will do in the short term, but for investors looking for reasons to be optimistic in the short term, we’ve included a graphic that we also spoke about in our video segment this quarter. This is a graph of a consumer sentiment index over time that measures how optimistic consumers feel about their finances and the state of the economy. As this shows, consumer sentiment is a contrarian market signal. Meaning that when consumer sentiment is low, as it is today, that has historically preceded a 12-month period of strong equity market returns (on average +24.9%).
For anyone looking for more fundamental reasons to be optimistic, we’ll note that corporate and household balance sheets are in good shape, labor markets remain strong, corporate profits and stock buybacks have continued to grow, and we may have already seen peak inflation. We certainly aren’t in the business of trying to call a market bottom or short-term market swings, but during periods when all anyone can see are the negatives we believe it’s more important than ever to recognize and point out the fact that there are still some positives.
Fixed Income
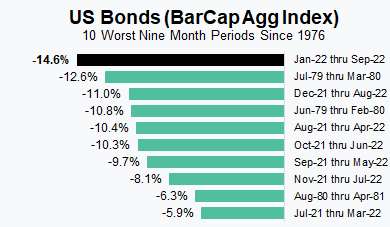
Stubbornly high inflation has forced the Fed to continue to be aggressive in their actions and communication about future interest rate policy. That has led to a prolonged period of poor fixed income results. In fact, year-to-date returns now rank as the worst nine-month stretch for the main U.S. bond benchmark extending back to 1976.
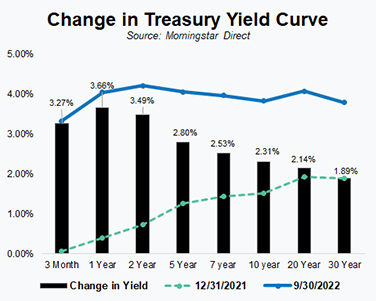
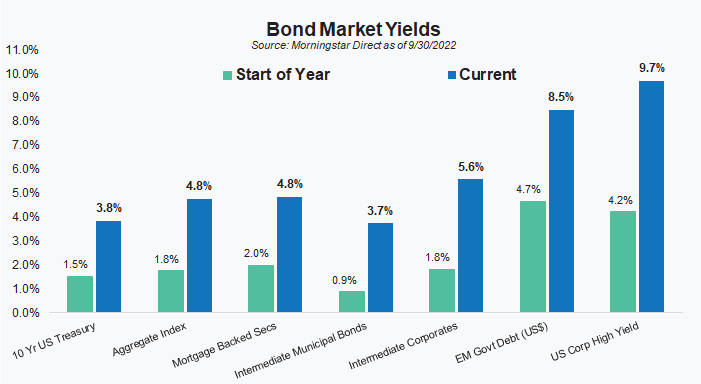
Investors have generally come to understand or tolerate the volatility we are seeing in stock markets, but what they are experiencing now in fixed income is a very new and unnerving experience. We certainly understand the concern, but as we’ve emphasized in the past, absent a credit event, fixed income losses should prove temporary. Negative returns for bonds and lower bond prices set those same bonds up for higher future returns. As the following graphs show the yield to maturity or return that an investor can expect from their bonds has changed quite a bit since just the start of the year. It’s obviously been a painful adjustment, but for those able and willing to wait until maturity or for those with cash to put to work the shift higher in yields increases future return expectations.
For investors tempted to wait until after the Fed is finished hiking rates to invest we’d like to point out that the considerable increase in yields year-to-date and the Feds willingness to lay out its future plans likely means that much of what the Fed will ultimately do is already priced in. After beginning the year very defensively positioned (short duration/low credit risk) we have already begun to adjust our positioning to take advantage of the increase in both yields and credit spreads. We wouldn’t characterize our positioning as aggressive by any stretch of the imagination, but we are methodically becoming less defensive the more rates increase.
Commodities + Real Assets (+ Alternatives)
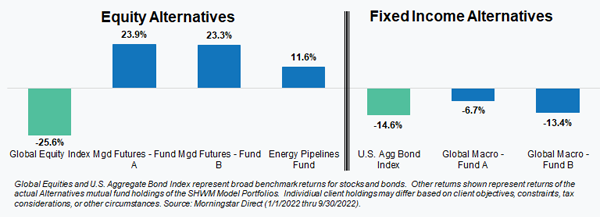
Last quarter we expanded this section of Your CFO Report to include a discussion on several Alternative strategies that we use in managing portfolios. With stocks and bonds continuing to struggle during the most recent quarter those strategies again proved valuable. Collectively they’ve produced a positive return this year and all five strategies have outperformed the more traditional markets that we compare them to and from which they are funded.
Unfortunately, the term “Alternatives” is not overly descriptive, so we wanted to provide more information on the three types of strategies that we employ. What the industry considers Alternatives or “Alts” is incredibly broad, but our focus within the category tends to be quite narrow as we simply don’t see much value in the majority of strategies and investment vehicle. Most strategies entail some sort of illiquidity, have high fees, lack transparency, and most importantly are far too correlated to traditional stocks and bonds – things we already own plenty of. The following is a brief summary on each of the three.
Trend Following Managed Futures
Unlike the rest of our portfolio this is the only component that is not valuation oriented or sensitive. These strategies, of which we have two, are momentum based. They look for price trends across global stocks, bonds, commodities, and currencies and don’t really care if those markets are going up or down – they can position for and profit either way. There is no guarantee, of course, but these strategies have a long history of doing well during difficult times and are sometimes called “crisis alpha” strategies. That ability to perform well when the rest of the portfolio may not is obviously what is so compelling.
Global Macro
These strategies look to take advantage of large-scale, macroeconomic developments across the globe. They have been at times characterized as “go anywhere, do anything” strategies, which at an industry level is mostly true. At S+HWM, we’ve defined the space a bit differently and focus on strategies that typically express their macroeconomic views through the purchase or sale of fixed income or currencies and that have volatility closer to what we’d expect from the bond market. As with Managed Futures, there is no guarantee these strategies will do well in any environment, but historically they do “no worse” and at times do quite a bit better. As I like to say, they have a “fighting chance” in a tough market.
Real Assets/Commodities/Infrastructure
Our last strategy, and the allocation to it, is driven more by our view of valuations in the sector than any market correlation expectations. Attractive valuations, stable cash flows, and high dividend yields led to our position in energy pipelines or infrastructure (sometimes called MLPs). These pipelines are considered “midstream” assets within the energy complex which means that rather than drilling for oil & natural gas (upstream) or selling it to the end user (downstream), they are focused on transporting or refining the hydrocarbons for which they charge a fee. While the underlying commodities themselves may see considerable price volatility, these businesses tend to enjoy stable cash flows and growth as their business is more like a toll keeper who charges a fee. We don’t necessarily expect a lot of correlation benefits from this position, but there are times (like this year, thankfully) where they perform well despite difficulties in other markets.
We continue to believe our approach to Alternatives is a differentiator. As we’ve seen over the last few quarters, investors tend to pile into Alternatives after the market has already declined, a point at which we are more likely to be selling and reallocating. We believe in allocating to such strategies when traditional markets are expensive or the risk to reward ratio for them unattractive. We know that means we’ll likely be a bit early, but we’d much rather be early than late and have no exposure when portfolios most need it.
While we are very pleased with how our strategies have held up during this difficult period, we know what matters to investors at the end of the day is the bottom-line. We understand and appreciate that. We can’t know or say when, but markets eventually will recover and portfolios along with them. Like you, we look forward to that day!
As always, our team of advisors is available and ready to answer your questions on these or other topics related to investments and financial planning. Please call us at 404-874-6244 or email us here.
Unless stated otherwise, any estimates or projections (including performance and risk) given in this presentation are intended to be forward-looking statements. Such estimates are subject to actual known and unknown risks, uncertainties, and other factors that could cause actual results to differ materially from those projected. The securities described within this presentation do not represent all of the securities purchased, sold or recommended for client accounts. The reader should not assume that an investment in such securities was or will be profitable. Past performance does not indicate future results.
Want to get insights right to your inbox?
Subscribe to our newsletter to get inside access to timely news, trends and insights from Smith and Howard Wealth Management.
 October 4, 2022
 Back to Insights